Task-oriented walkthroughs. Pick the goal that matches what you're trying to do
and follow the steps.
Quickstart
You don't need an account to start using Mindjack. Open the site, jump into any tool,
and start exploring. Login unlocks personal features (portfolio, rewards, wallet
network lookups); a paid plan unlocks higher daily limits, wallet labels, manual
analyses, and full Mindweb and Connections access.
Without logging in
You can browse most of the data on the site:
Open the Monitor and look up any token that has already been analyzed.
Open the Database to search tokens and wallets, or browse serial insiders, funder networks, and wallet clusters.
Get a swap quote on the Swap page (executing the swap requires a connected wallet).
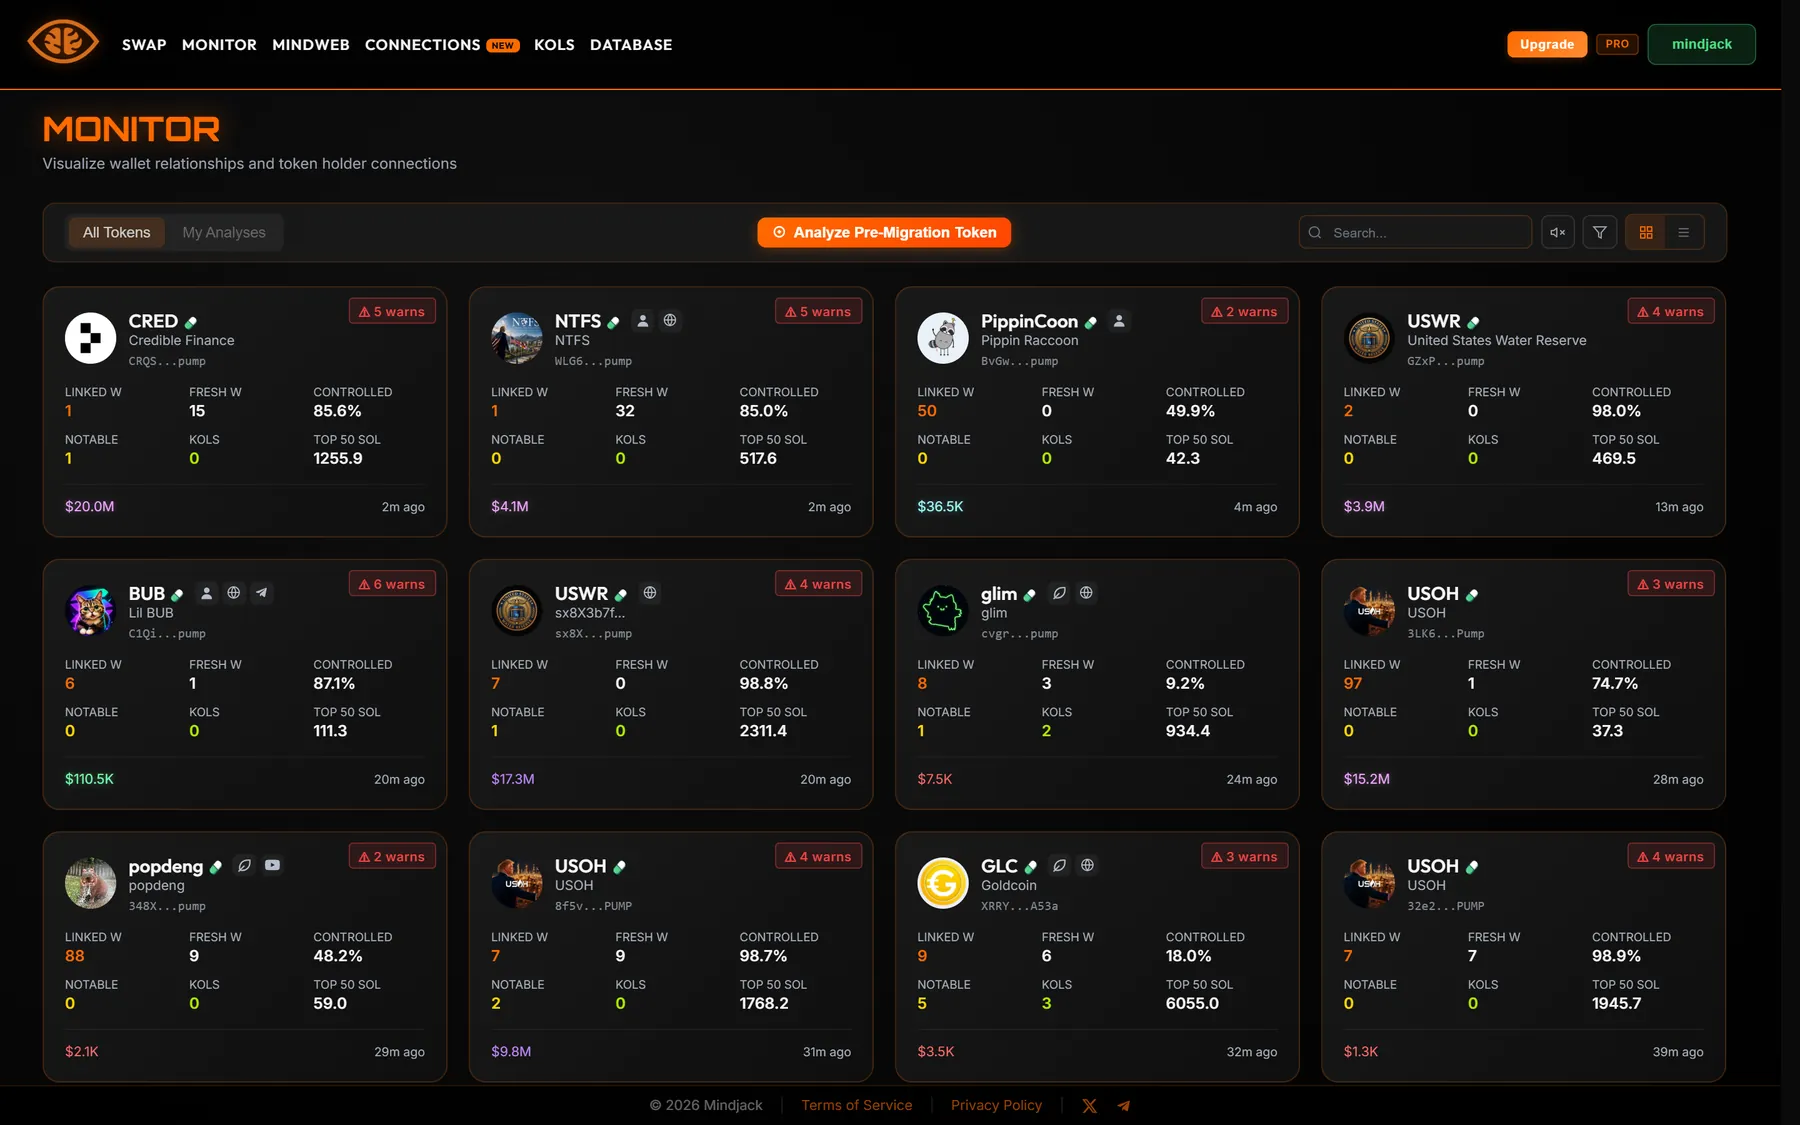
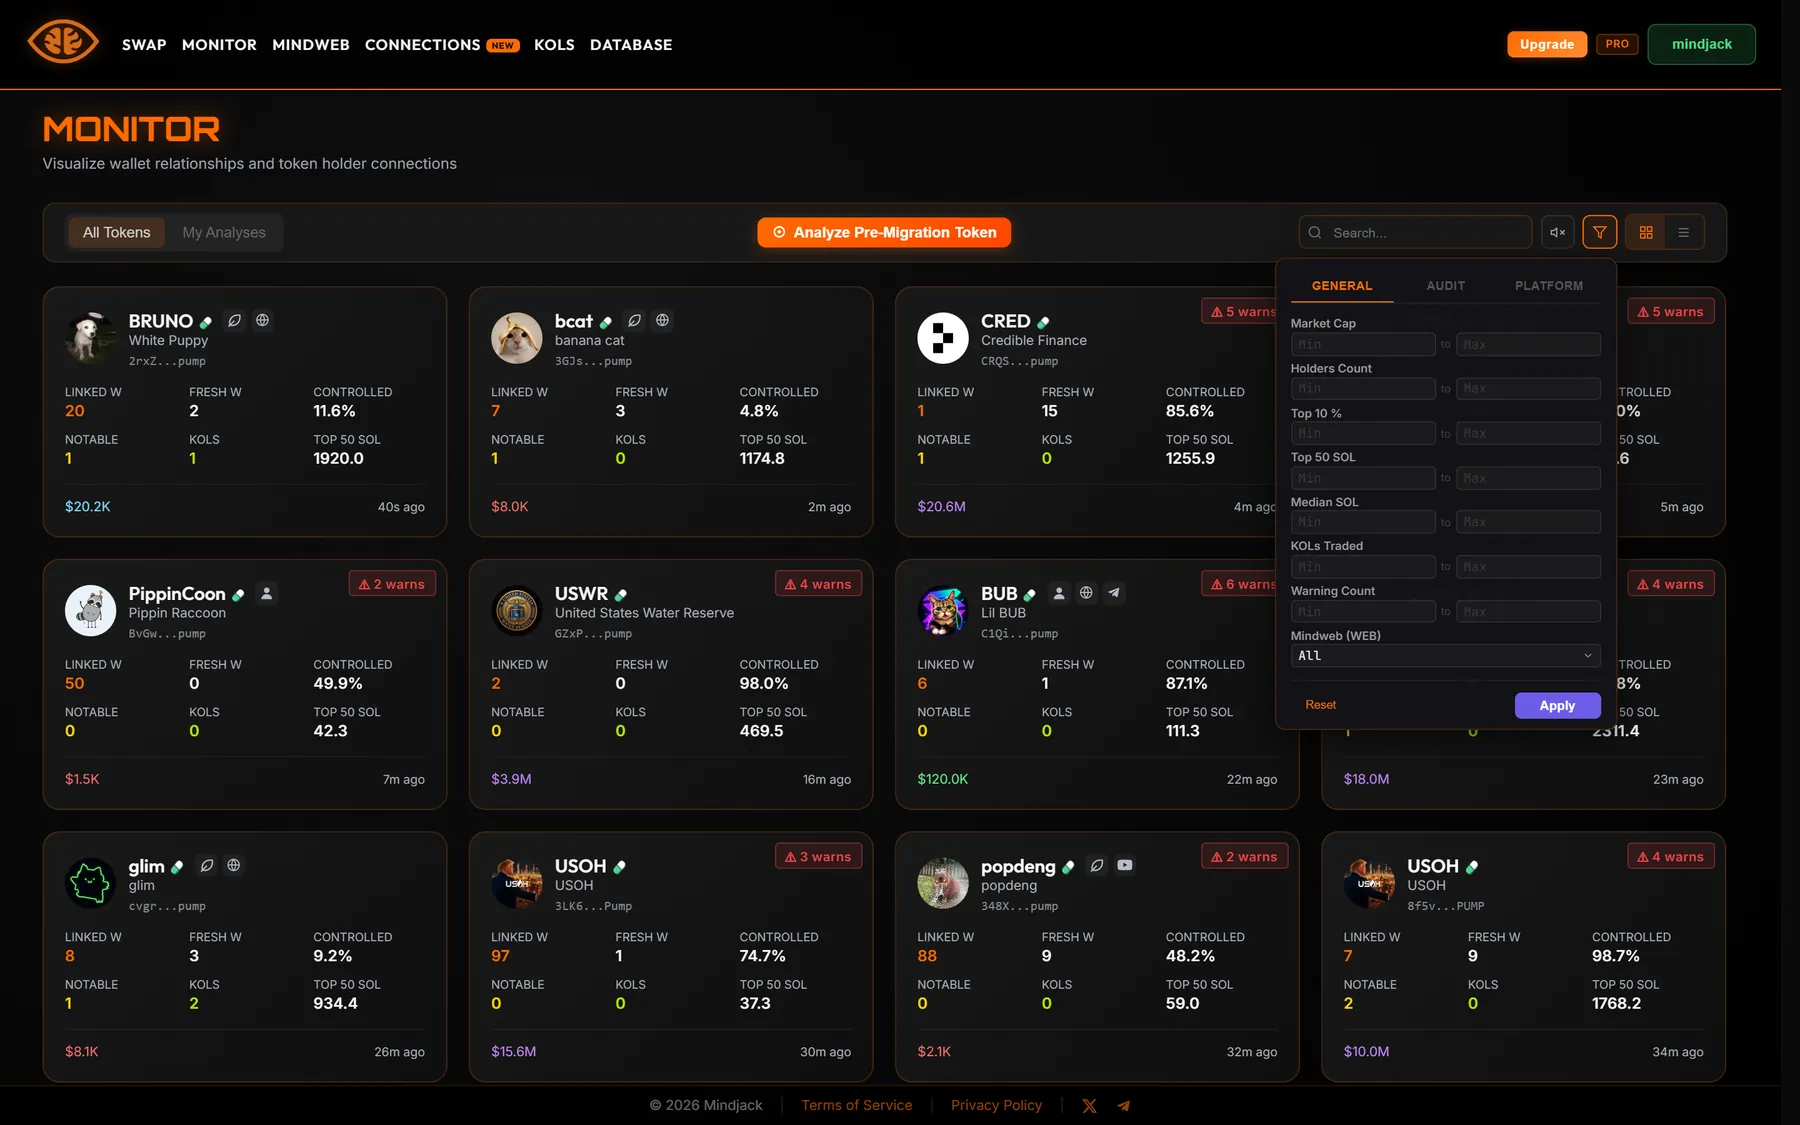
The Monitor token list. Every card is a completed analysis, public to everyone.
Where do these tokens come from?
Mindjack continuously monitors token launches on Solana and automatically analyzes
tokens that migrate from a launchpad to a full DEX. Those analyses are public — you
can browse them without paying or signing up. See
How analysis works for the full picture.
Viewing time caps for non-paying users
Two pages have daily viewing-time caps: the Monitor and the
KOL Tracker. Anonymous visitors get 3 minutes per day on each;
Free accounts get 15 minutes per day on each. Pro and Mindjacker have no cap.
Time is tracked with 60-second heartbeats while you are actively using the page,
so idle time does not count against you.
With a free account
Click Login in the navbar. The modal is titled "Sign in to Mindjack"
and offers up to seven options:
Email — one-time code sent to your inbox
Google
X (Twitter)
Phantom — wallet signature (no transaction)
Solflare
Backpack
Jupiter
Wallet options only appear if the matching browser extension is installed — on a
browser with no wallet, you'll see Email, Google, and X plus a "No wallets detected"
note. Wallet logins ask you to sign a message, and the modal states explicitly that
this "will NOT trigger any transaction." After signing in once you can pick
a username (3–20 characters, optional — you can skip and set it later).
A free account unlocks:
Your own Portfolio (1 wallet on Free)
Your Rewards page with a referral code and earnings tracker
Connections wallet lookups (3 per day on Free, preview depth)
The ability to swap tokens (1% fee on Free)
Higher daily quotas for viewing time and refreshing analyses
Going further
Some things require a paid plan or a one-time payment:
Manual pre-migration analysis — analyze a token before it migrates. Pro includes 5/day, Mindjacker 15/day. Without a plan, pay $5 per analysis.
Wallet labels — Pro and Mindjacker only.
Full Connections graph — indirect (multi-hop) links, funding sources, and shared tokens.
Mindweb connection details and Database comparison details.
Reduced swap fees — 0.75% on Pro, 0.5% on Mindjacker (vs 1% on Free).
Higher refresh quotas and bigger portfolios.
How analysis works
This is the part that confuses most new users, so it's worth slowing down on. Mindjack
analyses come from two paths.
1. Automatic analysis (free, public)
Mindjack runs a background monitor that watches Solana launchpads. When a token
migrates from a launchpad to a full DEX market, the system analyzes it
automatically and saves the result.
You don't have to do anything to trigger this — it just happens.
The result is public: anyone can pull up the token in the Monitor or Database without paying or signing in.
This is where the vast majority of the tokens in the Database come from.
Every analysis is a snapshot
An automatic analysis captures the token at the moment it migrated — that's why the
panel is labelled Migration Snapshot. It does not update on its own.
To pull newer holder data, open the token and hit Refresh.
2. Manual analysis (paid or quota)
If a token hasn't migrated yet and you want to see what's going on
with its early holders, you can request a manual analysis from the Monitor page. The
button is called Analyze Pre-Migration Token and the modal spells out
the constraint clearly:
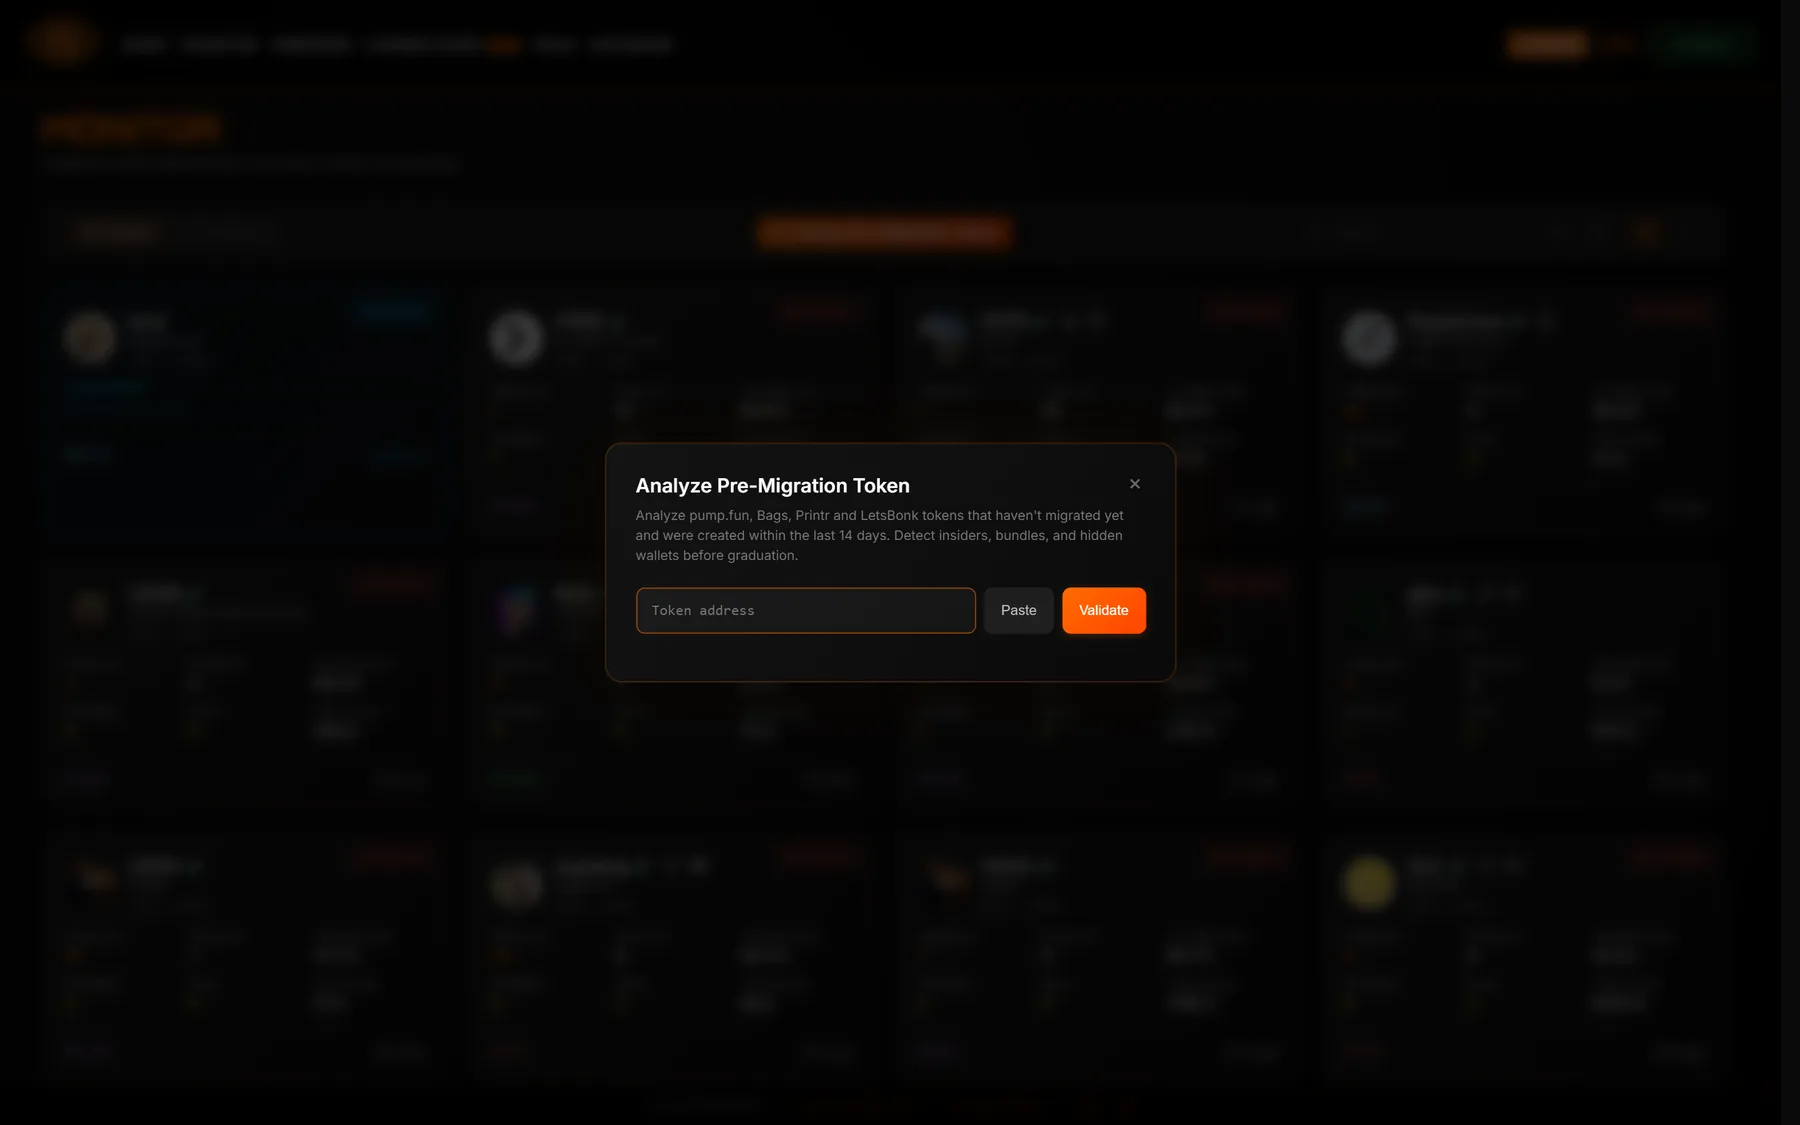
"Analyze pump.fun, Bags, Printr and LetsBonk tokens that haven't migrated yet and were
created within the last 14 days. Detect insiders, bundles, and hidden wallets before
graduation."
Step 1 of a manual analysis: paste the address and hit Validate.
So the requirements are:
The token must be on a supported launchpad — pump.fun, Bags, Printr, or LetsBonk.
It must not have migrated yet — still on the bonding curve.
It must have been created within the last 14 days.
The flow
Paste the token address into the modal and click Validate. The system checks the requirements and shows the current queue length.
Pick how to pay for the analysis (see the three methods below).
Click the action button. Your request enters the queue — usually only seconds.
When it finishes, the result appears under the My Analyses tab on the Monitor page.
Three ways to pay
Method
Cost
Who it's for
Use Daily Quota
Included in your plan
Pro: 5/day · Mindjacker: 15/day · Free: none
Use 1 Credit
Free — but you have to earn them
You get 1 credit back when a manual analysis fails or is cancelled. Capped at 10.
Pay $5
$5 in SOL or USDC, one-time
Anyone with a connected wallet, no plan needed.
After it migrates
Manually-analyzed tokens are private to you until the token migrates to a DEX. Once
that happens, the result becomes part of the public database like any other migrated
token.
Refreshing vs analyzing
Once a token has been analyzed (either automatically or manually), you can
refresh it to pull a newer holder snapshot. Refreshes are cheap and
counted against a daily quota:
Free: 5 refreshes per day
Pro: 50 per day
Mindjacker: 500 per day
The Refresh button inside a token view shows your remaining quota as a badge, so you
always know where you stand.
Researching a token before you buy
The most common job: someone drops a contract address in a chat and you want to know
whether it's worth your attention. Mindjack doesn't tell you "this is good" or "this
is bad" — it surfaces signals and warnings. Your job is to weigh them.
Step 1 — Find the token
Paste the address into the search box on the Monitor, or search
it on the Database page. If the token has been analyzed (that
is, it has migrated), the result appears immediately. Click it to open the full view.
Token not in the database?
That means it hasn't migrated yet. If it's a pump.fun, Bags, Printr or LetsBonk token
created in the last 14 days, you can run a
manual pre-migration analysis from the Monitor page.
Otherwise, wait for it to migrate — Mindjack will analyze it automatically.
Step 2 — Check the warnings
Mindjack flags risky tokens with warning chips — yellow or red badges
on the token card. There are six categories:
Holders — total holder count is too low
Controlled Supply — too much of the supply is held by coordinated groups
Top 10 Holder — the top 10 wallets together hold too much of the supply
Top Holder — a single wallet holds too much
Median SOL — the median SOL balance across top holders is anomalous
Snipers — too much of the supply sits in sniper wallets
Yellow chips are warnings — worth a second look. Red chips are
critical — treat with serious caution. The Warning Count
filter lets you narrow the token list by how many warnings a token has triggered.
There are no "green signals"
Mindjack does not produce positive endorsements. Absence of warnings is not a buy
signal — it just means none of the six categories tripped. Always cross-check with
the data in the monitor itself before acting.
Step 3 — Read the monitor
Open the token's full view and work through it in this order:
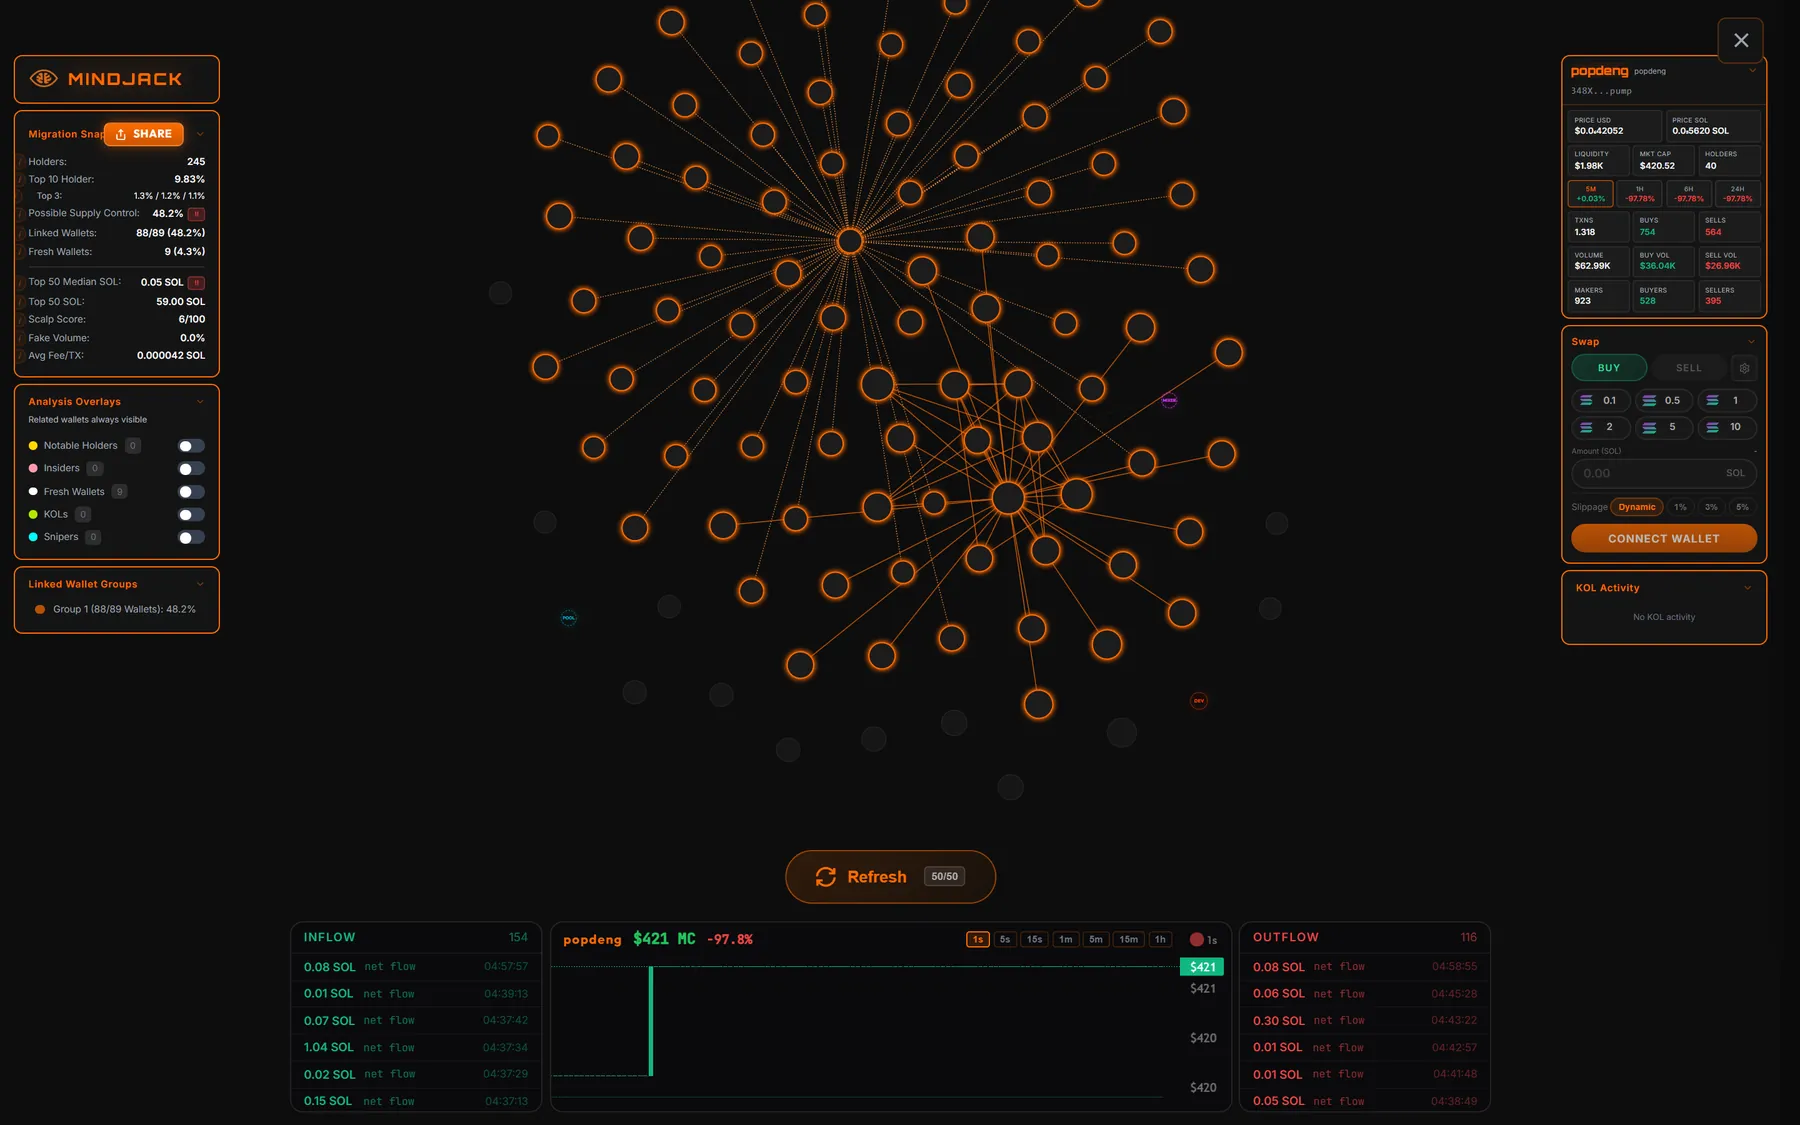
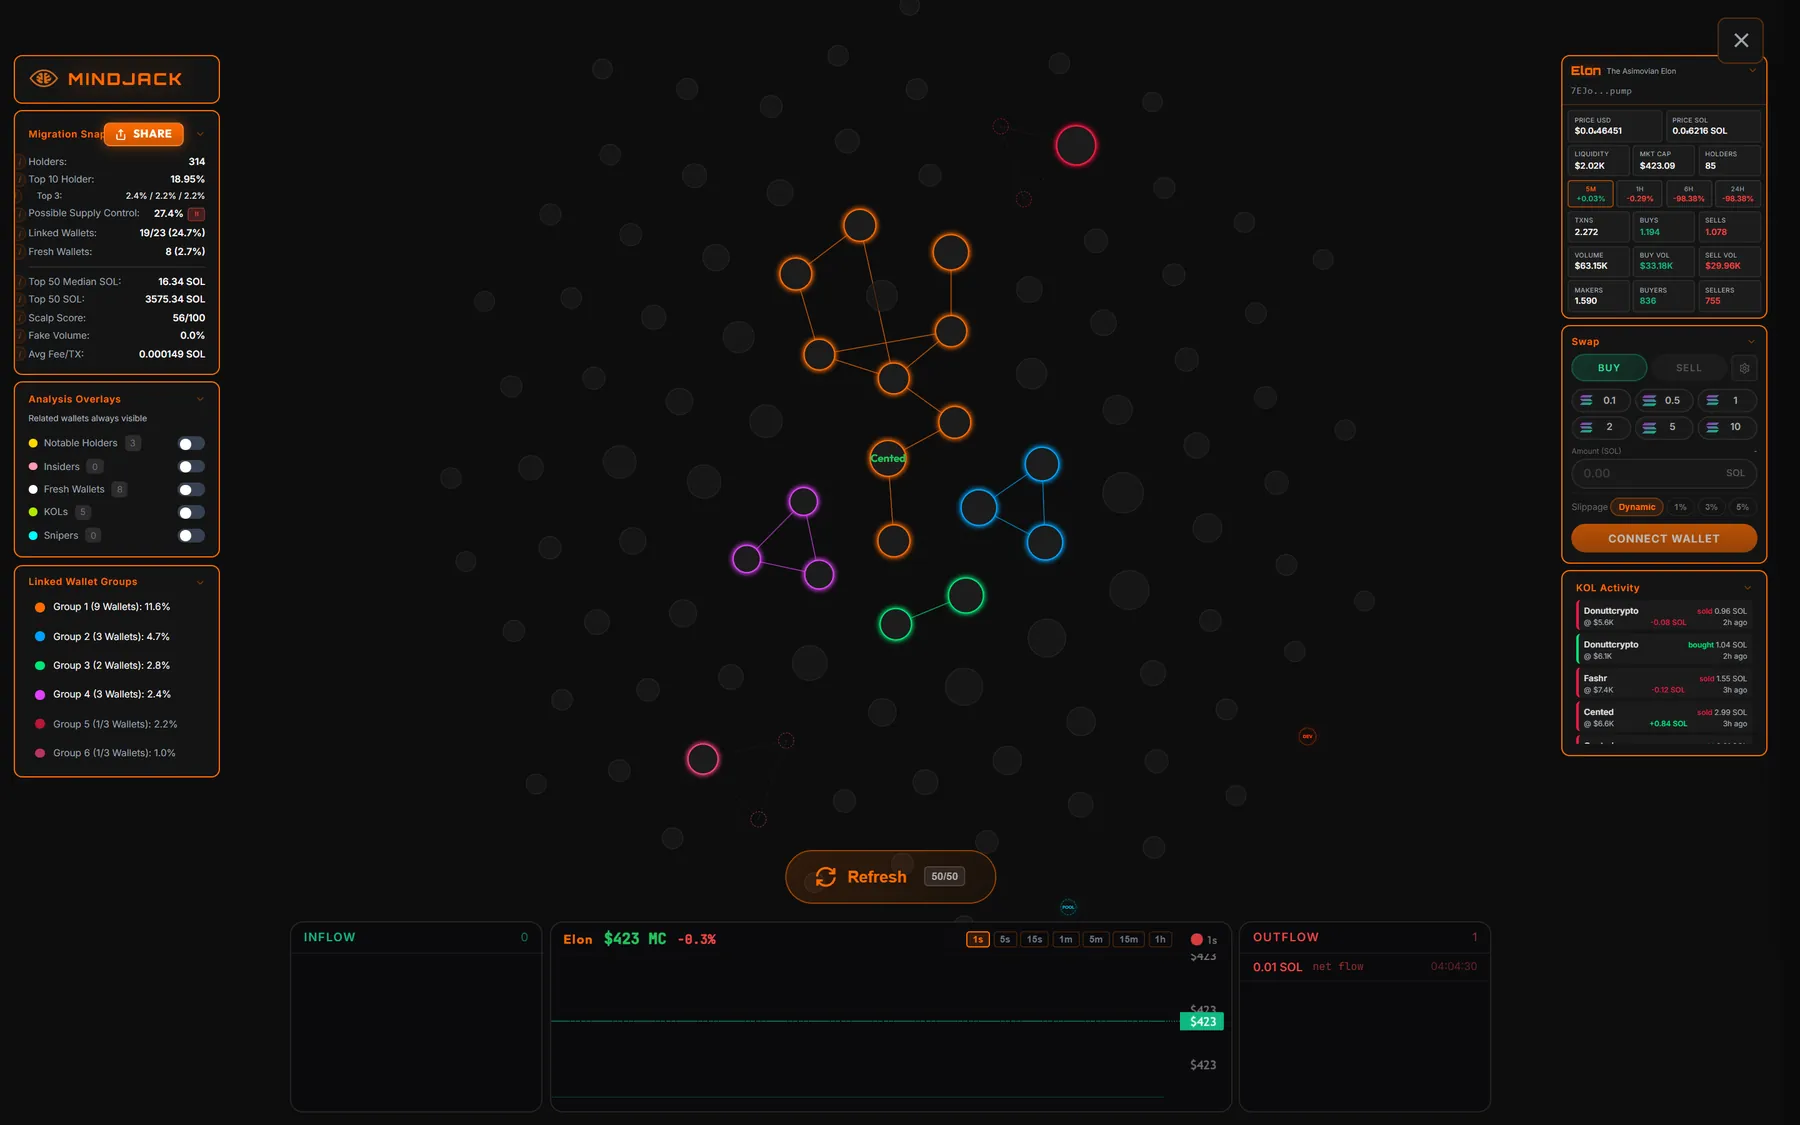
A single linked group holding 48% of supply. Hub-and-spoke shapes like this usually mean one funder bankrolled many wallets.
Migration Snapshot (top-left panel) — the headline numbers: holders,
top 10 %, top 3 split, possible supply control, linked wallets, fresh wallets,
top 50 median SOL, top 50 SOL, scalp score, fake volume, average fee per transaction.
The graph itself. Each node is a holder; node size tracks position
size and edges show detected relationships. Big tight clusters of one color mean
wallets we've grouped together.
Linked Wallet Groups panel — every detected group with its wallet
count and the share of supply it controls. Groups keep stable colors between
refreshes, so you can watch one grow or shrink over time.
Analysis Overlays — toggle Notable Holders, Insiders, Fresh Wallets,
KOLs, and Snipers on the graph. Each row shows a live count, so you can see at a
glance whether a category is even present.
Trading data (top-right) — price, liquidity, market cap, holders,
plus transactions, volume and makers split by buys and sells. One-sided activity is
suspect.
KOL Activity — if any tracked wallet traded this token, its buys and
sells appear here with entry market cap and realized PnL.
A note on methodology: Mindjack combines multiple on-chain signals to make these calls.
We intentionally don't publish the exact rules or thresholds — it would make the system
easier to game. Use the indicators as inputs to your own judgement, not as a guarantee.
Mapping a wallet's network
The Monitor answers "who holds this token?". Connections
answers the opposite question: "who is this wallet connected to, and how?"
Paste any wallet we've analyzed and you get its entire counterparty network on one
screen.
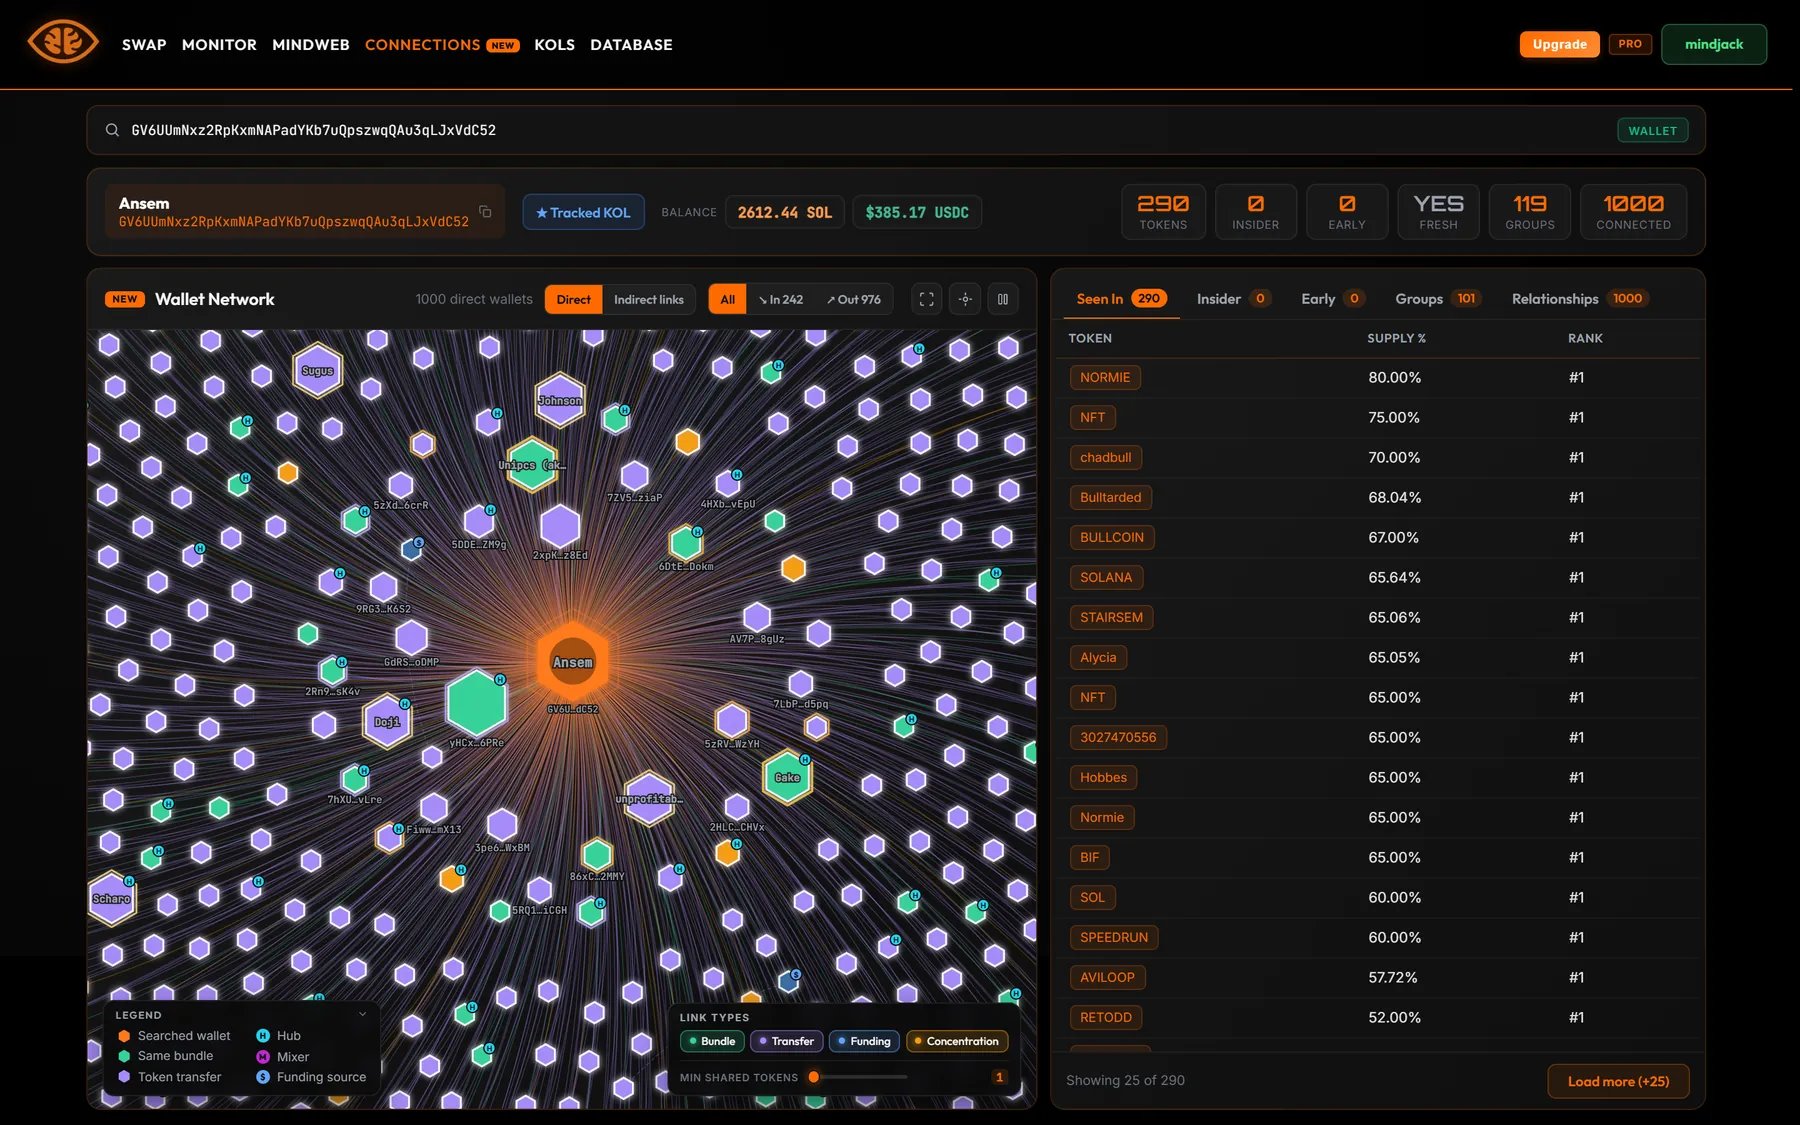
A wallet network: 1,000 direct counterparties, colour-coded by how the link was formed.
Go to Connections and paste a wallet address, or click "View wallet connections" from a KOL profile.
Read the header strip — balance in SOL and USDC, plus counters for tokens seen in, insider flags, early-investor flags, fresh status, groups, and total connected wallets.
Start on Direct: every wallet with a first-degree link. Switch to Indirect links to expand two hops out.
Use the link type chips to isolate one kind of relationship at a time — Bundle, Transfer, Funding, or Concentration.
Use In / Out to separate incoming from outgoing transfers when you're trying to work out who funded whom.
Switch to the right-hand tabs for the tabular view: Seen In, Insider, Early, Groups, Relationships.
Daily lookup limits
Connections requires an account. Free gets 3 lookups per day and a
preview of the network (the nearest few wallets in full, the rest locked). Pro gets
25 per day with the full graph plus indirect links. Mindjacker is
unlimited.
Tracking smart money
Mindjack maintains a curated list of Solana wallets we consider smart money — KOLs.
Their activity is surfaced live on the KOL Tracker. You don't need
to log in to view it.
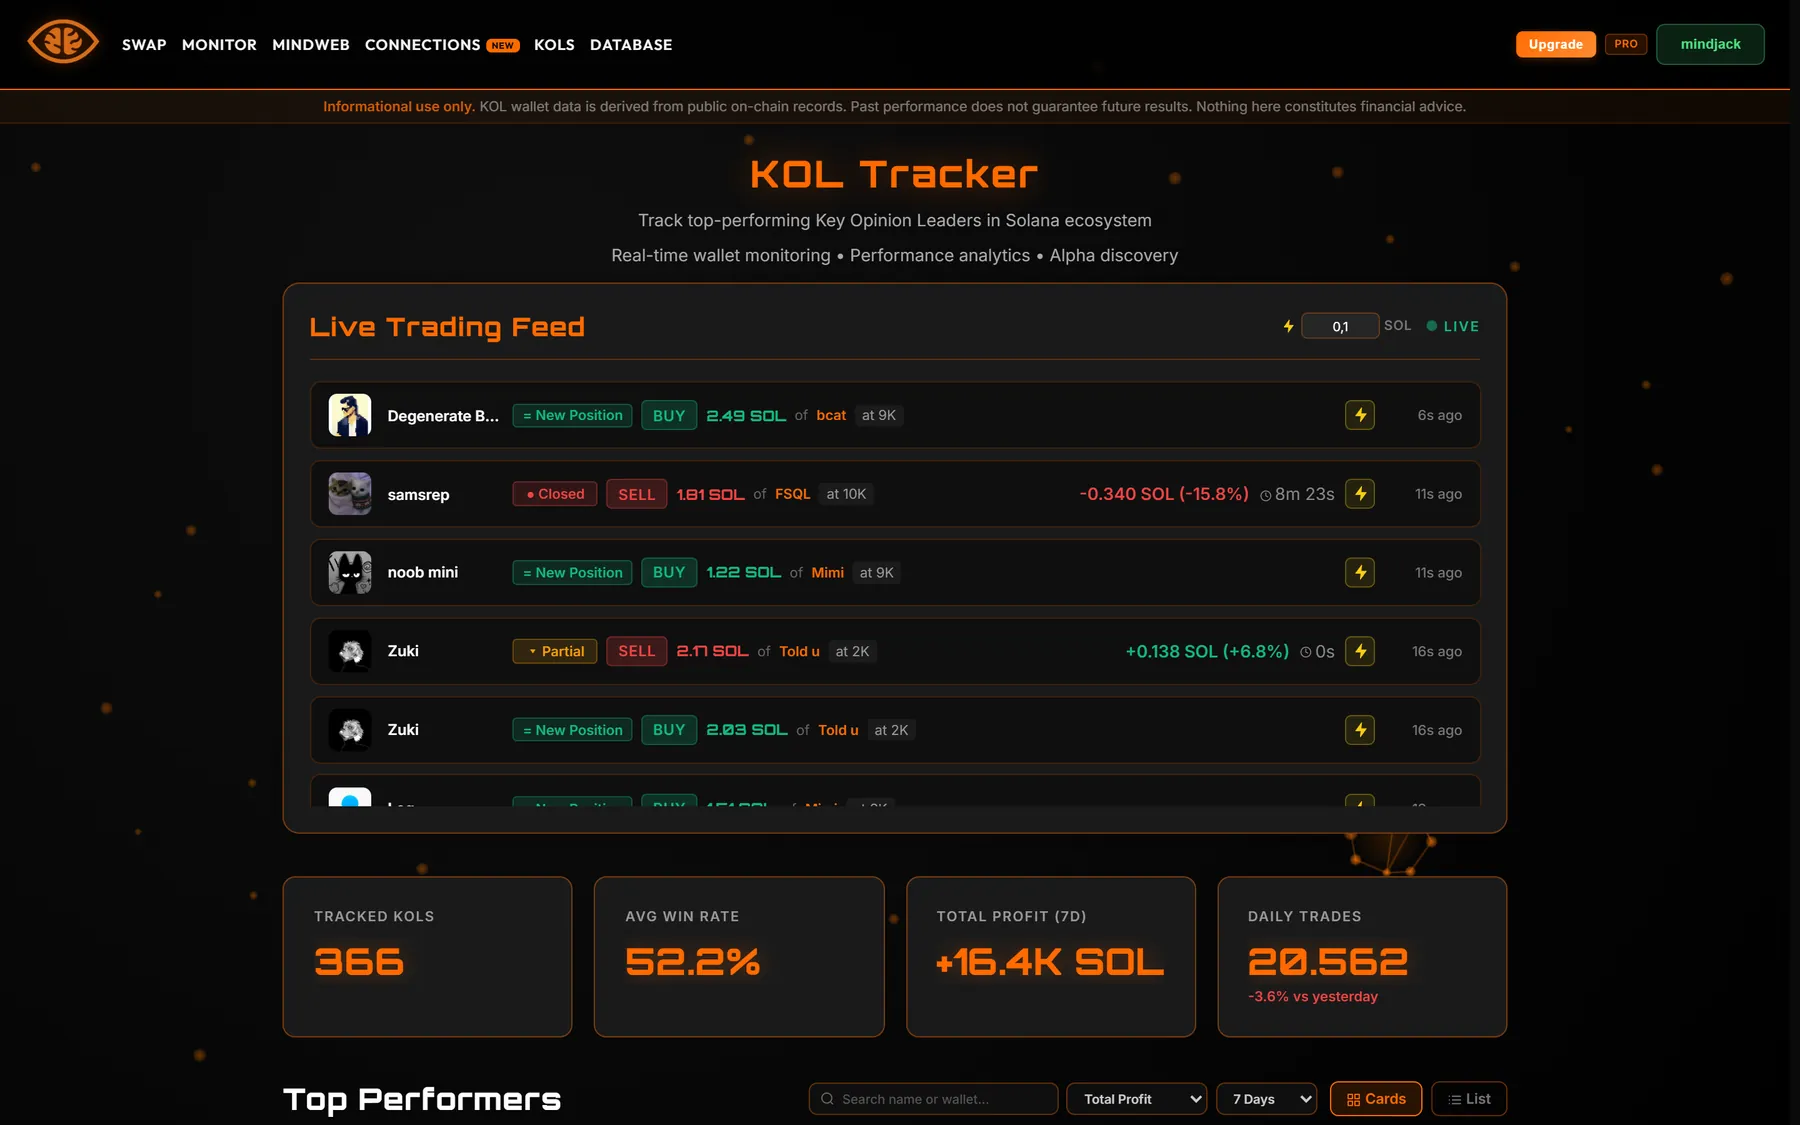
The live trading feed. Each row is a tracked wallet opening, adding to, or closing a position.
Discovering KOLs
The Top Performers leaderboard ranks tracked wallets by performance.
Sort by total profit, win rate, or median hold time, pick a time window
(1 / 7 / 14 / 30 days), and click any wallet to open its profile.
Reading a KOL profile
Each profile shows win rate, total profit, trade count, and a list of recent trades.
Look for consistency over time rather than a single big win — a long string of small
profitable trades is usually a better signal than one outlier. From the profile you can
jump straight into that wallet's Connections graph.
Spotting KOLs on a token
When a tracked KOL holds a token, they light up under the KOLs overlay
in that token's monitor and appear in the KOL Activity panel with each
buy and sell. In the expanded chart, their entries and exits are drawn directly on the
candles as avatar markers, alongside average KOL entry and exit price lines. This is the
fastest way to answer "is anyone smart in this trade, and where did they get in?"
Monitoring new launches
Mindjack watches Solana launchpads in the background. When a token migrates, it gets
analyzed automatically and added to the public database. You don't have to do anything
to make this happen — but there are three things you can do to react faster.
Browse newly migrated tokens
The Monitor list is sorted newest-first, so freshly migrated tokens are always at the
top, with a relative timestamp on each card. Switch to list view for a
dense table when you want to scan many tokens at once.
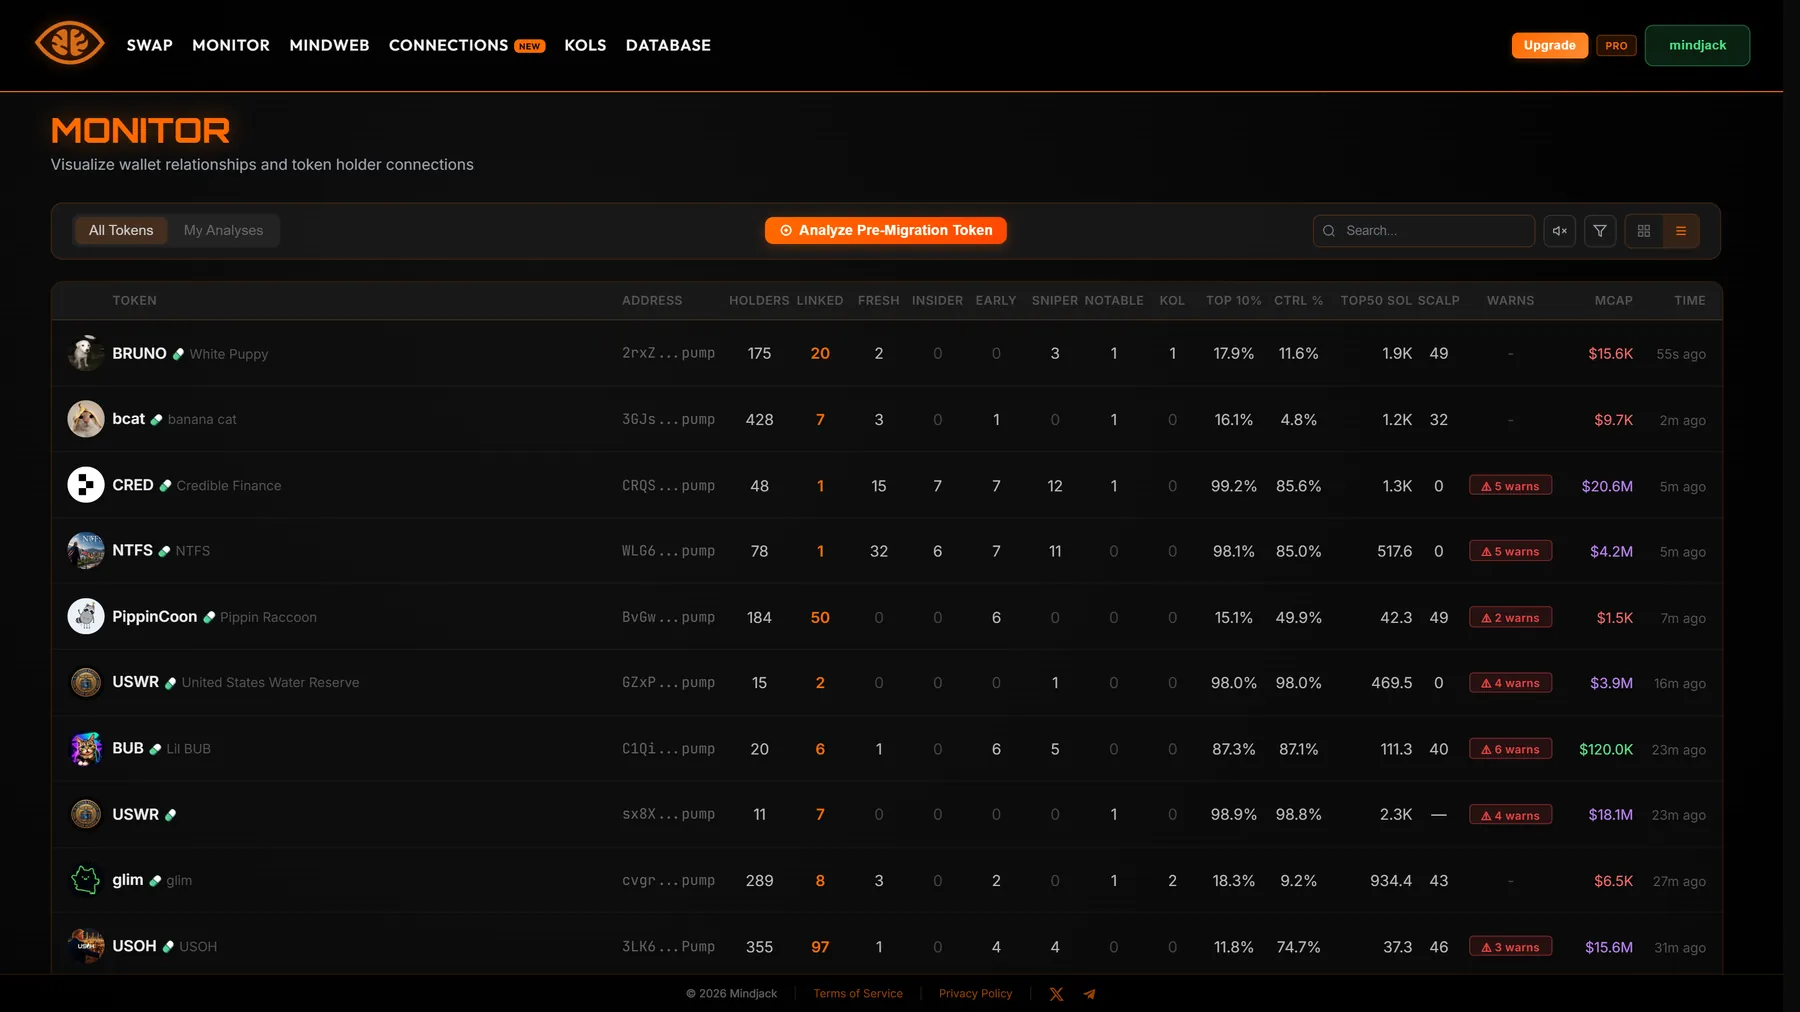
List view: every metric as a column, one row per token.
Filter down to the launches you care about
Save yourself the scrolling: set a market cap floor, a minimum holder count, a maximum
top-10 percentage, or a minimum number of KOLs traded, and the list only shows launches
matching your thesis. Filters persist while you browse and the funnel icon shows a badge
with how many are active.
Refresh a single token
A token view is a snapshot from the moment it was analyzed. To pull in newer holder data
after a launch keeps moving, hit Refresh inside the token view.
Refreshes count against your daily quota (Free 5 · Pro 50 · Mindjacker 500).
Watch pre-migration tokens
To see a token's structure before it migrates, run a
manual analysis. This is the only way to see the holder
structure during the bonding curve phase.
Managing your portfolio
The Portfolio page tracks Solana wallets and shows their
holdings, allocation, and value in one place. You need a free account to use it.
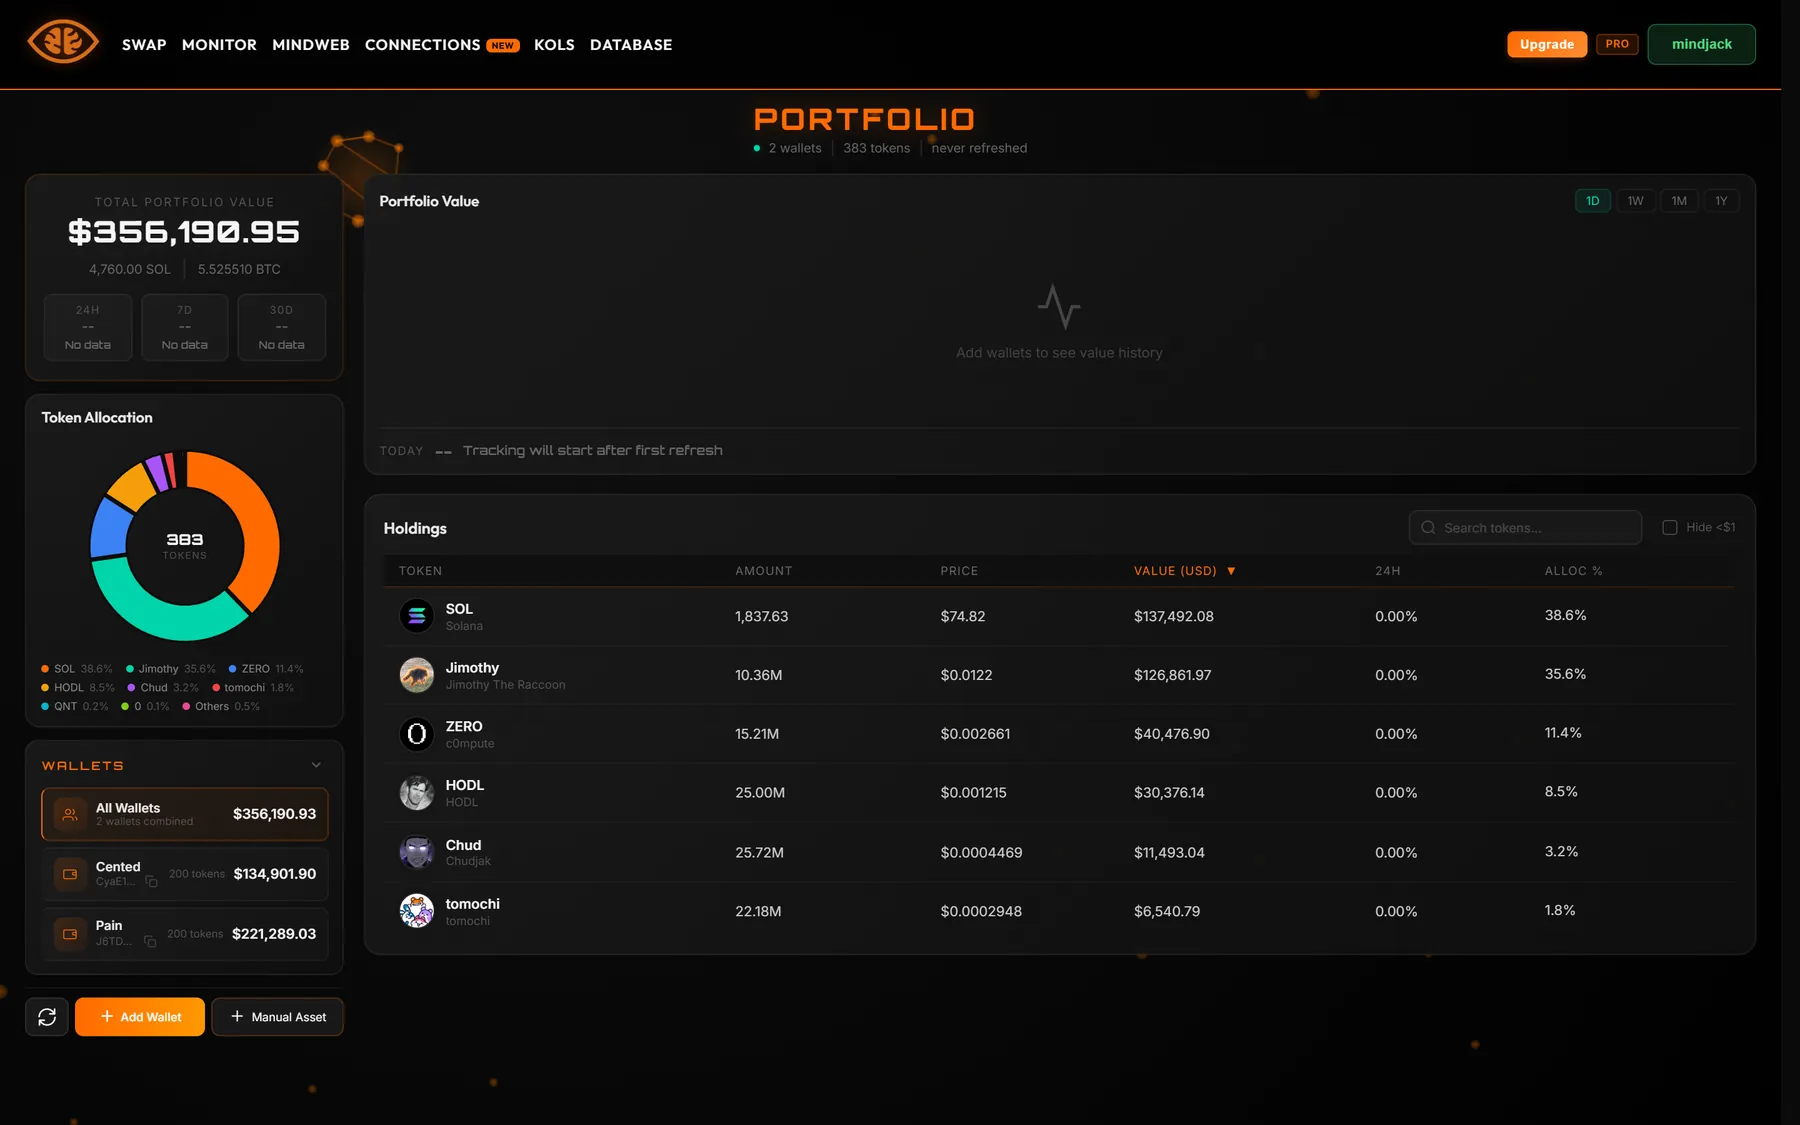
Two tracked wallets, combined into one view with an allocation breakdown.
Adding a wallet
Click Add Wallet and paste any Solana address — it doesn't have to be
your own, which makes this a decent way to watch a wallet you found elsewhere on the
site. Give it a label so you can tell wallets apart. Each tier has a cap:
Free 1 · Pro 20 · Mindjacker 100.
Reading the dashboard
Total Portfolio Value — combined USD value, with SOL and BTC conversions and 24h / 7d / 30d PnL badges.
Portfolio Value chart — value history over 1D / 1W / 1M / 1Y. History starts accumulating after your first refresh.
Token Allocation — donut breakdown of what you're actually holding.
Wallets — per-wallet subtotals, plus an "All Wallets" combined view.
Holdings — sortable table of every token with amount, price, value, 24h change and allocation share. "Hide <$1" clears out dust.
Manual assets
Manual Asset adds a position by hand — useful for holdings that aren't
in the tracked wallets. Free 10 entries · Pro 30 · Mindjacker 50.
Refreshing
On Free you refresh manually, up to 3 times per day. Pro and Mindjacker refresh
automatically roughly every hour, with unlimited manual refreshes on top.
Swapping tokens
The Swap page routes through aggregated Solana DEX liquidity. You
can browse quotes and market data without logging in, but executing a swap requires a
connected wallet linked to your account.
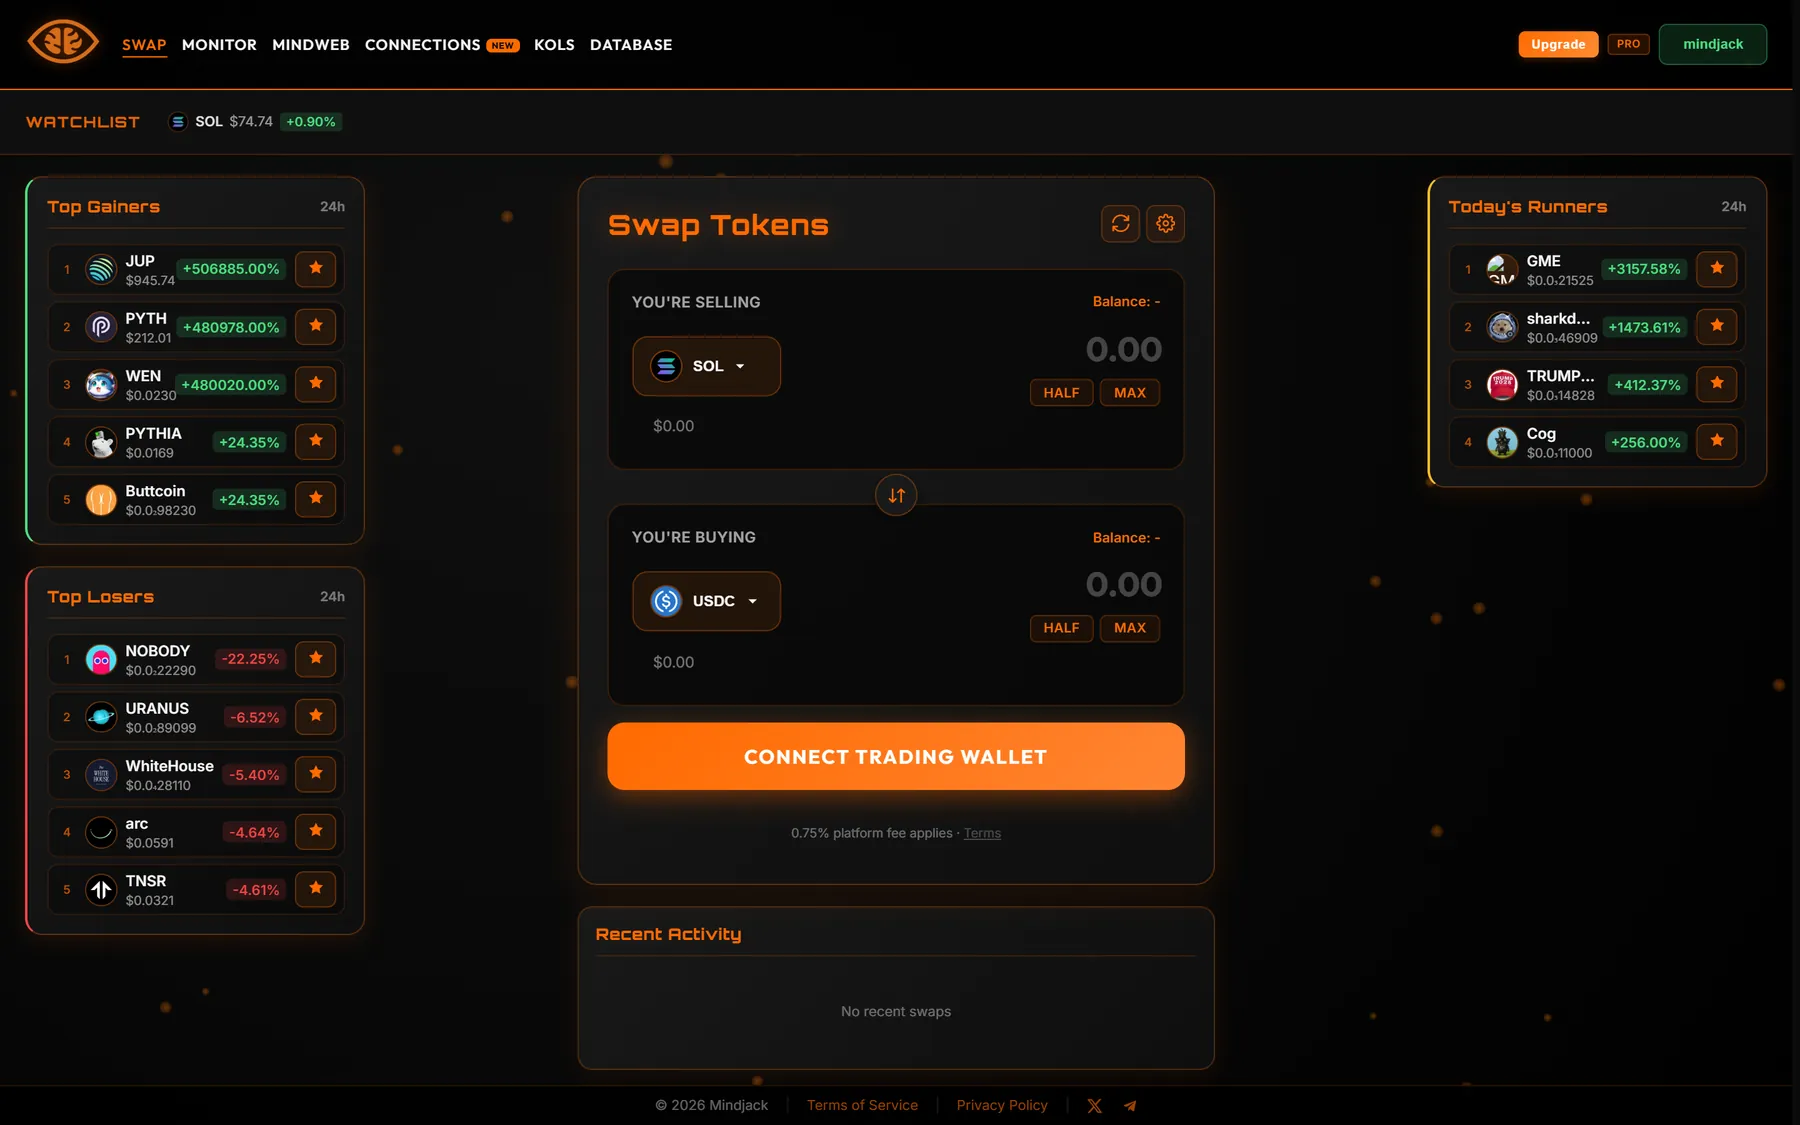
Swap, flanked by market movers and your watchlist.
Fees by tier
Free: 1% per swap
Pro: 0.75% per swap
Mindjacker: 0.5% per swap
The fee that applies to you is printed under the swap button before you confirm anything.
Executing a swap
Pick the tokens you're selling and buying, then enter an amount (or use HALF / MAX).
Review the quote, rate, and price impact.
Set slippage tolerance. Defaults are conservative; widen them for low-liquidity tokens.
Click Swap and approve the transaction in your wallet.
Wallet linking
The wallet you swap from has to be linked to your Mindjack account. The first time you
swap, the site walks you through signing a one-time message to confirm you own the
wallet. After that, you can swap freely.
Market data and watchlist
The page also carries Top Gainers, Top Losers and
Today's Runners over 24h. The star icon on any row adds that token to
your Watchlist, which pins it to the ticker bar at the top of the page.
Recent Activity lists swaps you've made through Mindjack.
Tools
Tool reference
A walkthrough of every tool in Mindjack — what you see, what each control does,
and what the numbers mean.
Monitor
The Monitor is the centerpiece. It has two layers: the token list
(browse and filter every analyzed token) and the token view (open a
single token to see its wallet graph, market data, chart, and an embedded buy/sell
panel).
Important: data is a snapshot
Tokens are analyzed at the moment of migration. What you see is a snapshot from that
moment and it does not update automatically. Open a token and hit
Refresh to fetch newer holder data.
All Tokens vs My Analyses
Two tabs at the top of the page:
All Tokens — every token Mindjack has analyzed, public to everyone.
My Analyses — tokens you personally requested via manual pre-migration analysis. Login required.
The token card
In card view each token shows its icon, name and symbol, shortened address, and social
links when the project published them. Underneath: Linked W,
Fresh W, Controlled %, Notable,
KOLs, Top 50 SOL, market cap, and how long ago it was
analyzed. Warning chips sit in the top-right corner.
Filter panel
The funnel icon opens a three-tab filter panel. The icon carries a badge with the number of active filters.
Every filter is a min/max range. Reset clears them, Apply reloads the list.
General
Market Cap — token market cap range
Holders Count — total holder count range
Top 10 % — share of supply held by the top 10 holders
Top 50 SOL — total SOL held by the top 50 wallets
Median SOL — median SOL balance across the top wallets
KOLs Traded — number of tracked KOLs that have traded this token
Warning Count — how many warnings the token has triggered
Mindweb (WEB) — All, Only WEB, or Hide WEB. "WEB" tokens are the ones connected to other tokens in the Mindweb graph.
Audit
Controlled % — share of supply held by wallets in coordinated groups
Fresh Wallets — count of freshly created wallets among the top holders
Linked Wallets — count of wallets grouped into relationships
Filter by the launchpad or DEX platform the token came from.
List view columns
The view toggle (top-right) switches between cards and a table. In table view the
columns are: Token, Address, Holders, Linked, Fresh, Insider, Early, Sniper, Notable,
KOL, Top 10%, Ctrl %, Top50 SOL, Scalp, Warns, MCap, and Time.
Warning chips
Each token can carry up to six warning chips, each either yellow (warning) or red (critical):
Warning
What triggered it
Holders
Total holder count is too low
Controlled Supply
Coordinated groups hold too much of the supply
Top 10 Holder
Top 10 wallets together hold too much
Top Holder
A single wallet holds too much
Median SOL
Median SOL balance across top holders is anomalous
Snipers
Too much supply is in sniper wallets
Yellow = take a closer look. Red = serious caution. There are no green / "all clear"
chips — absence of warnings is not the same as a positive signal.
The token view
Click any token to open its full view. Six areas make up the screen.
Six detected groups, each with its own colour on the graph and its share of supply.
1. Migration Snapshot
The headline panel, top-left. Holders, Top 10 Holder, Top 3 split, Possible Supply
Control, Linked Wallets, Fresh Wallets, Top 50 Median SOL, Top 50 SOL, Scalp Score,
Fake Volume, and Avg Fee/TX. Rows that tripped a warning carry an inline severity
marker. The Share button here generates a shareable card (see below).
2. Analysis Overlays
Five toggles, each with a live count: Notable Holders,
Insiders, Fresh Wallets, KOLs,
Snipers. Turning one on highlights the qualifying wallets on the graph
in that category's colour. Related wallets are always visible regardless of the toggles.
Opening the Notable Holders panel gives you the full list — the threshold is a token
position worth $5K+, or $25K+ in SOL and stablecoins.
3. Linked Wallet Groups
Every group detected for this token, sorted by the share of supply it controls, with the
number of wallets in each. Group colours and IDs are stable across refreshes, so a group
you were watching keeps its identity.
4. The wallet graph
Drag to pan, scroll to zoom. Each node is a holder, node size tracks position size, and
edges show detected relationships. Click a node for wallet details and to label it.
5. Token info, chart and market data
Top-right: name, symbol, socials, and PRICE USD,
PRICE SOL, LIQUIDITY, MKT CAP,
HOLDERS. Below it a live chart, price change badges
(5M / 1H / 6H / 24H), and three split readouts:
TXNS — total transactions, split into BUYS and SELLS
VOLUME — total volume, split into BUY VOL and SELL VOL
MAKERS — unique addresses, split into BUYERS and SELLERS
6. Quick Swap and KOL Activity
A buy/sell panel and a feed of tracked-wallet trades on this token, both covered below.
Every panel on the left collapses. Click a panel's title bar and it folds down to just
the header, so you can clear space for the graph and keep only what you're using open.
Click again to expand.
Using the overlays
The overlays are the fastest read on a token. Each row in the
Analysis Overlays panel is a toggle with a live count next to it, so
before you switch anything on you already know whether a category exists here at all —
"Insiders 0" tells you as much as a graph full of them.
Flip a toggle and every qualifying wallet on the graph lights up in that category's
colour. Toggles stack: turn on Fresh and KOLs together and you can see instantly whether
the fresh wallets are clustered around a group or scattered.
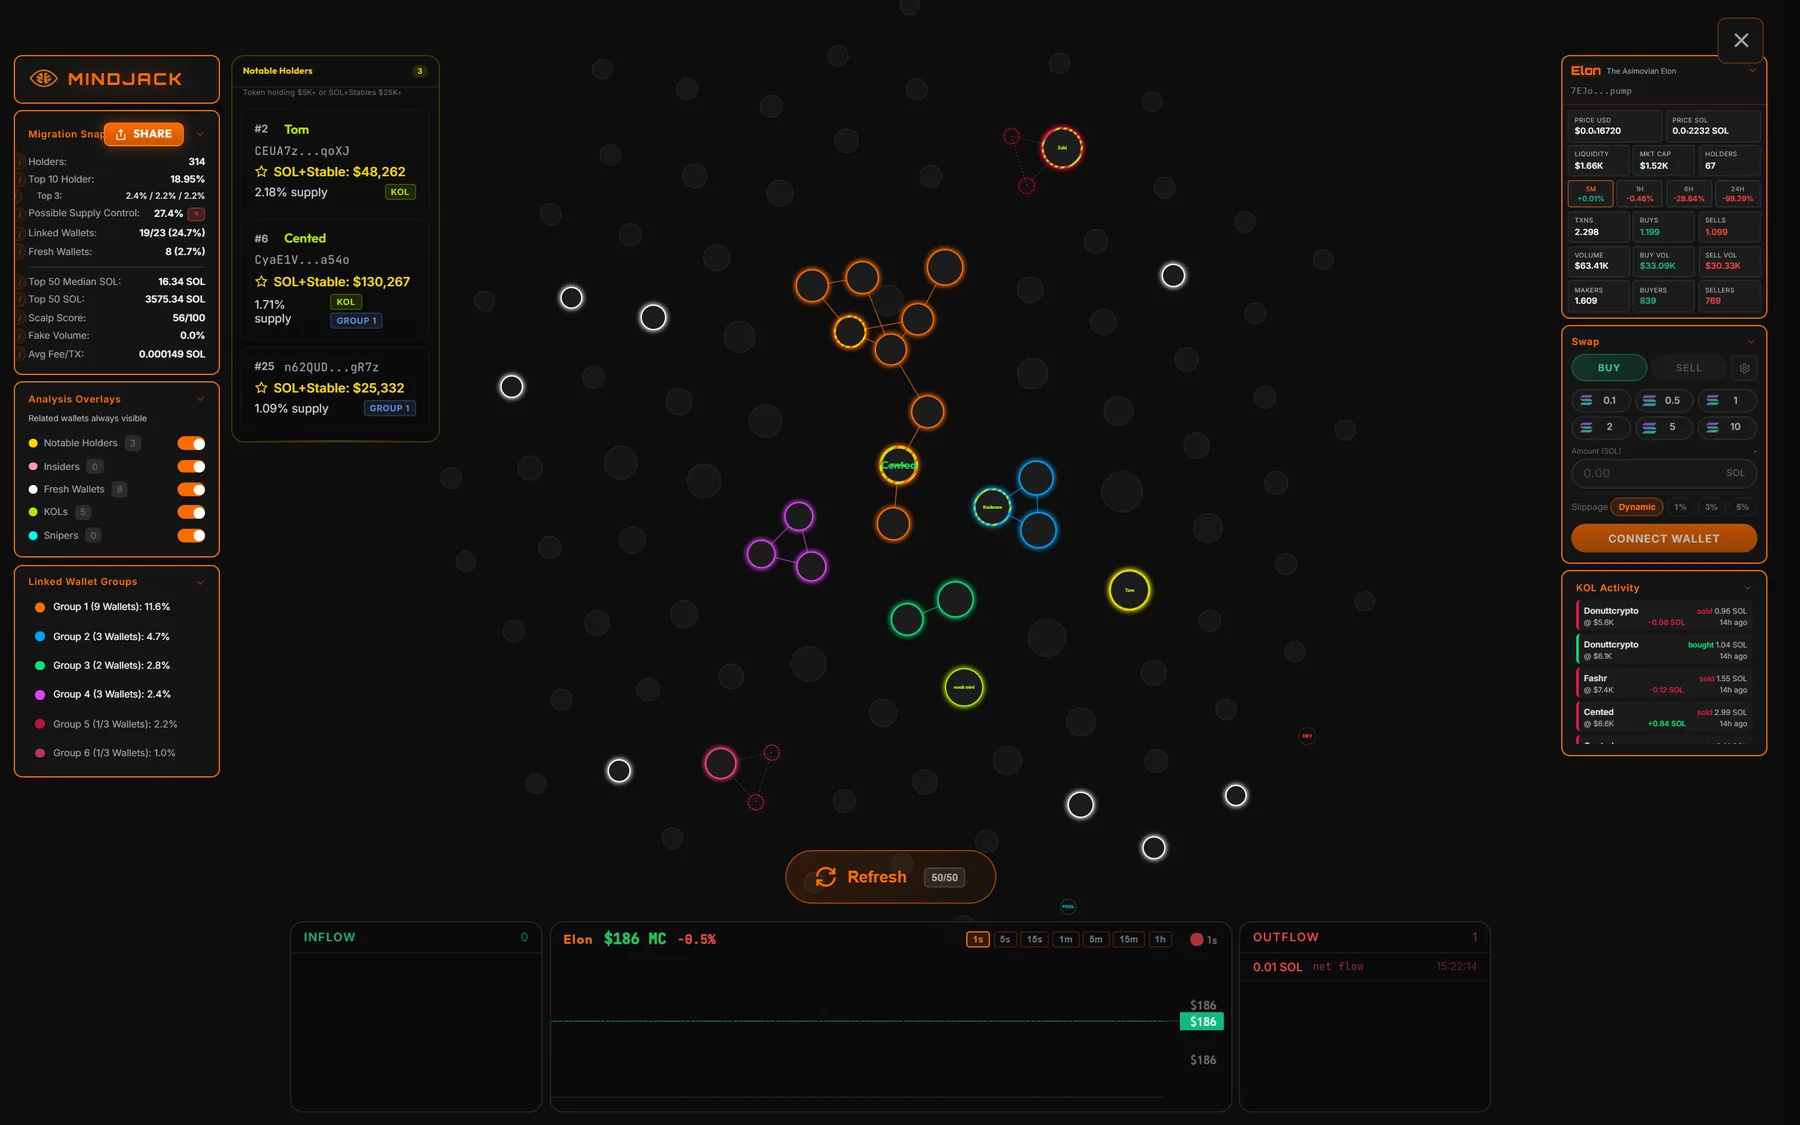
All five overlays on. White rings are fresh wallets, lime is a KOL, gold is notable — and the Notable Holders panel has slid out on the left.
Clicking the Notable Holders row opens its own panel listing each one
with holder rank, name or label, address, combined SOL + stablecoin value, share of
supply, and chips for KOL status and group membership. The threshold is a token position
worth $5K+, or $25K+ in SOL and stablecoins.
Node colours
When you toggle an overlay, qualifying wallets are highlighted with one of five colours:
Notable — wallet with a significant balance or trading history
Insider — early buyer with significant position size
Fresh — recently created wallet with little prior activity
KOL — tracked smart-money wallet
Sniper — bought in the very first moments of trading
Ghost nodes — a relevant wallet that isn't a current top holder, such as a funder that
bankrolled several holders — appear on the graph too, drawn differently rather than
getting a dedicated overlay colour.
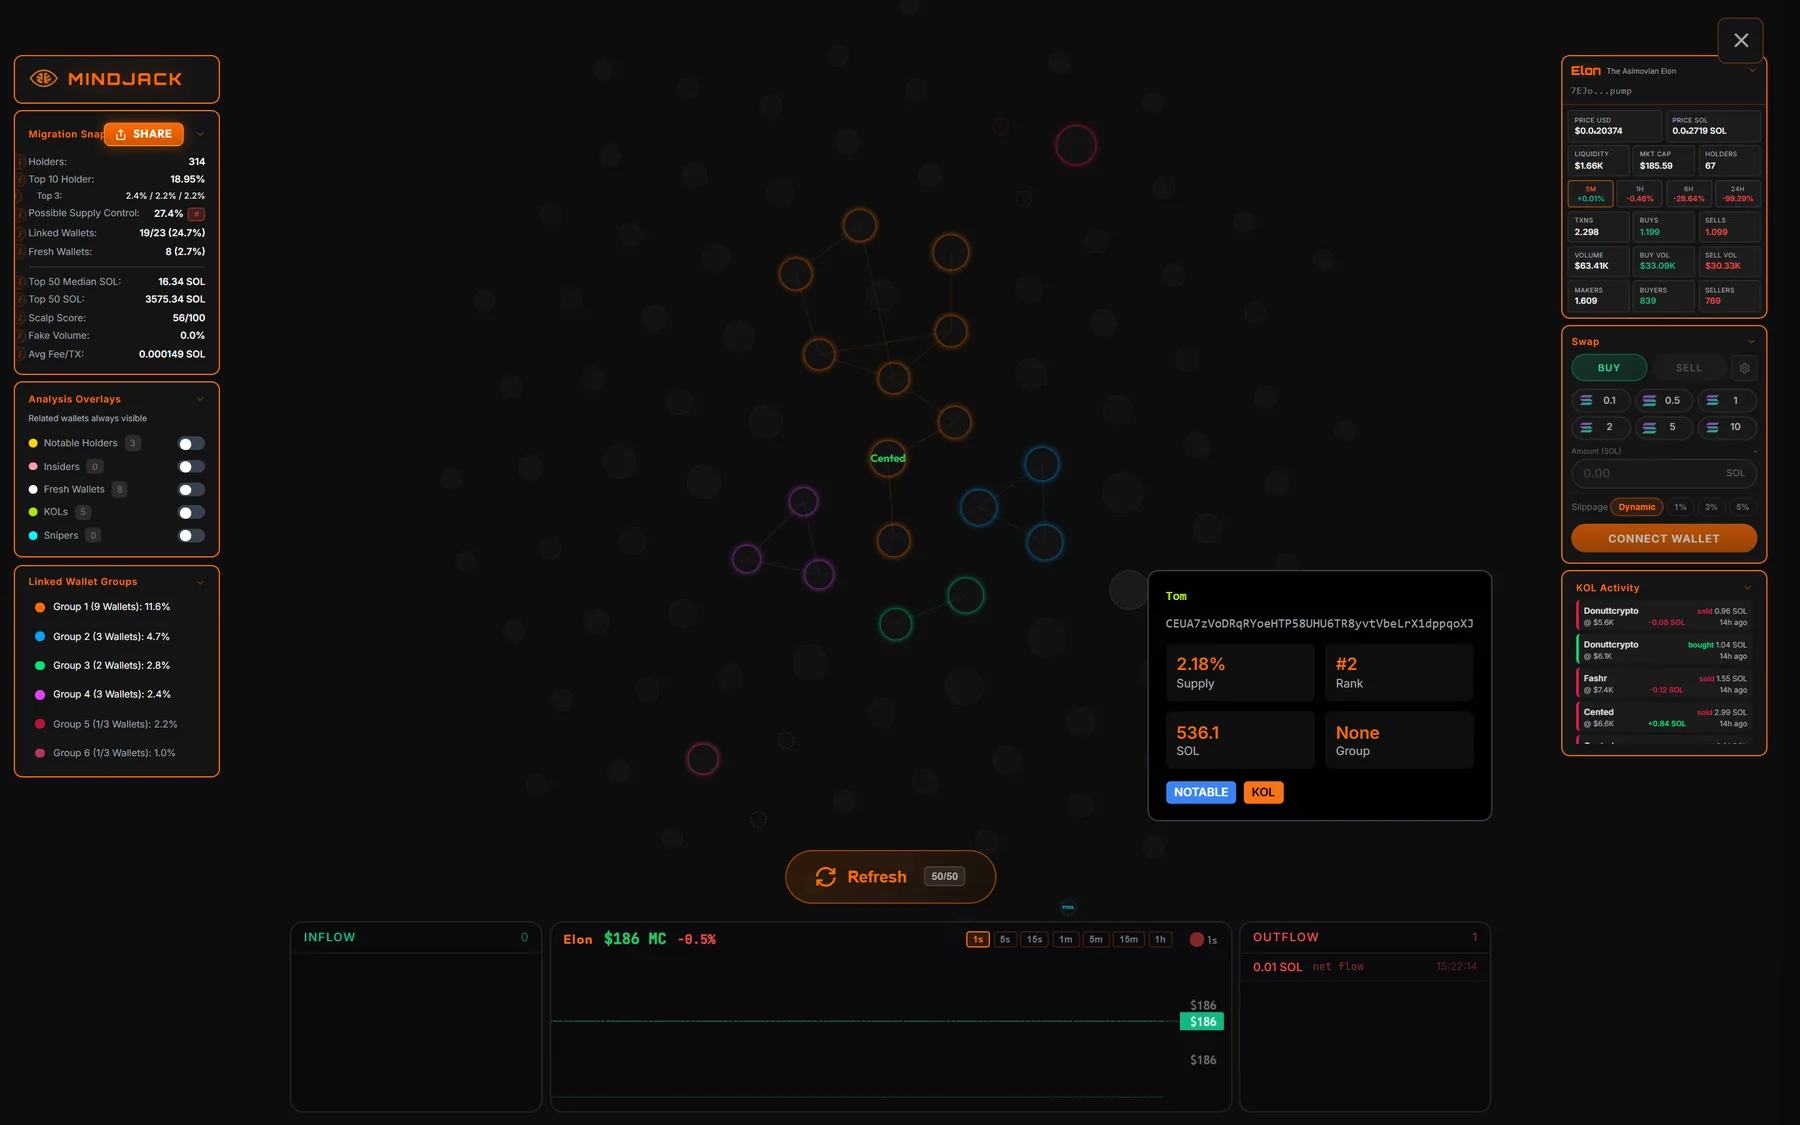
Hovering a wallet
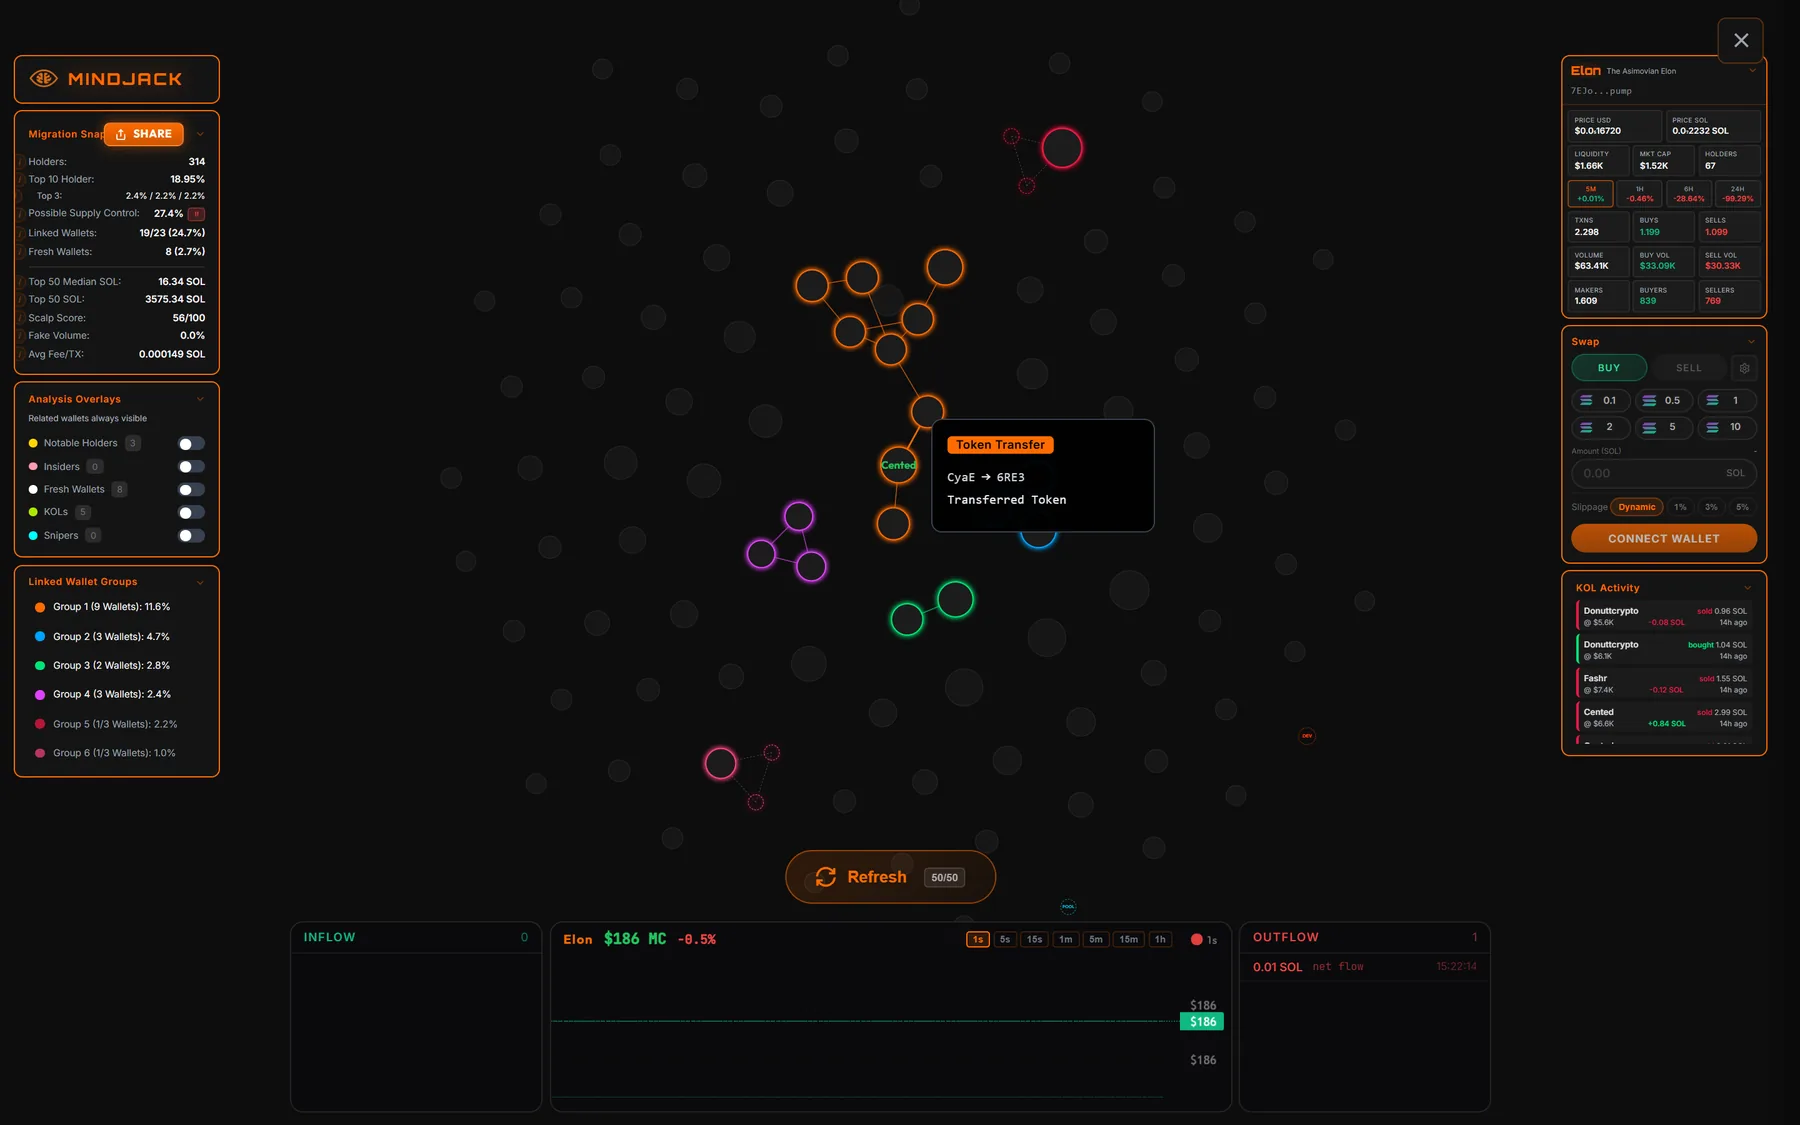
Hover any node and two things happen: a tooltip appears, and the rest of the graph dims
so only that wallet and everything connected to it stay lit. That dimming is the quickest
way to see how far a wallet's reach goes without clicking anything.
Hover tooltip. The graph behind it has dimmed to this wallet's connections only.
The tooltip carries:
Your own label for the wallet, if you set one, in the colour you picked
The KOL name, if it's a tracked wallet
The full address
Supply · Rank · SOL · Group
Badges for everything that applies: LOCKED, LIQ POOL, BRIDGE, DEV, MIXER, LEFT TOP 100, FRESH, NOTABLE, INSIDER, KOL, SNIPER
After a refresh, the change in that wallet's supply share since the previous snapshot
Clicking a wallet: Wallet Intel
Click a node and the Wallet Intel panel slides in from the right. This
is the deepest view of a single wallet inside the Monitor: everything we know about it,
both on this token and across every other token we've analyzed.
The whole panel for a tracked KOL wallet, scrolled out into one image.
Sections appear only when there's something to show. The full set:
Address — shortened, with copy-to-clipboard and a link out to Solscan.
Badges — the same detection badges as the hover tooltip.
View in Connections — jumps straight to this wallet's full network graph.
Your Label — name the wallet, pick a colour, add notes. Saved to your account and shown everywhere on the site. Pro and above; Free sees the section greyed out with an upgrade link.
Lock details — for locked or vesting positions: platform, status, vesting type, cliff date, full unlock date, total locked, and remaining.
Core Stats — Supply, Rank, SOL Balance, and the group it belongs to.
Wallet Type — identity where one is known: name, type (e.g. labeled wallet, exchange, mixer), category, and tags.
Fresh Wallet — wallet age and the funding facts behind the fresh flag.
Sniper Info — SOL spent and how the entry was timed.
Developer Info — for a token creator: how many tokens they've launched before.
KOL profile — for tracked wallets: handle, win rate, profit, trades, avg ROI, avg entry, median hold, and win/loss record.
Trades on this token — every buy and sell that wallet made here, with size and the market cap it traded at.
Token P&L and Overall Performance — SOL in and out on this token, and lifetime PnL.
Seen In Other Tokens — every other analyzed token the wallet holds, with supply share and rank. Expand a row to drill in.
Hovering a connection
The lines matter as much as the nodes. Hover an edge and a tooltip explains
why those two wallets are linked — that's the evidence behind the grouping,
not a guess.
Edge tooltip: what kind of link it is, which way it ran, and how much moved.
The tooltip is tagged with the relationship type. What you'll see:
Tag
What it means
SOL Transfer
One wallet sent SOL to the other. Shows sender → receiver and the amount.
Token Transfer
This token moved directly between the two wallets, with the amount where we have it.
Transfer
A transfer relationship without a resolvable direction or amount.
Common Funder
Both wallets were funded from the same source.
Funding Network
They sit in the same funding chain, one or more hops apart.
Bundle
They bought together in the same launch transaction.
Bridge
The link runs through a bridge address.
Early High Concentration
Both bought early and together hold a concentrated share of supply.
Low SOL Cohort
They belong to a cohort of wallets funded with unusually similar small amounts.
Connection
A relationship detected from shared transaction activity.
Where more than one transaction backs a link, the tooltip says how many — a pair with
forty transfers between them is a very different signal from a pair with one.
The chart
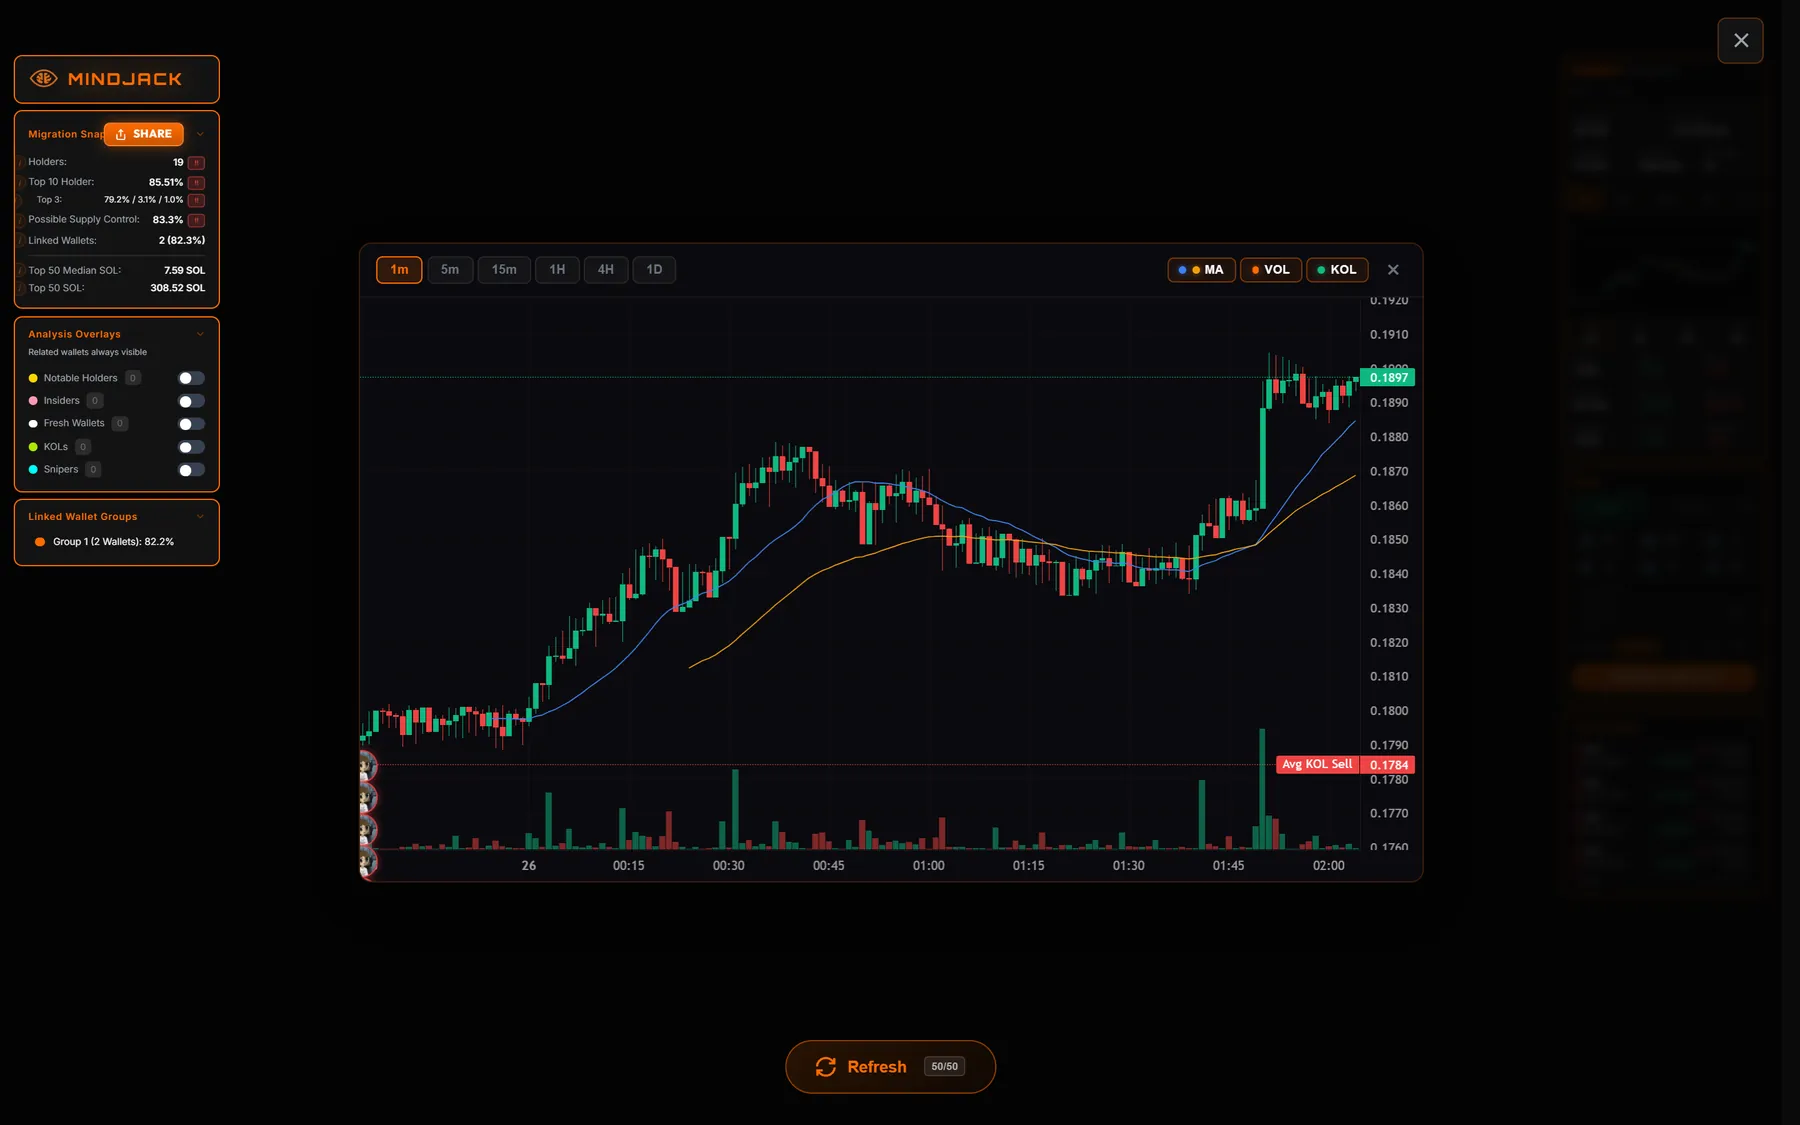
The mini chart sits under the token info box; the expand icon opens it full-screen.
Timeframes run 1m / 5m / 15m / 1H, and the expanded view adds
4H and 1D. Tokens with a live tick feed also expose
1s / 5s / 15s.
Expanded chart with MA, volume, and KOL markers enabled.
Three indicator toggles sit in the expanded chart header:
MA — a 20-period simple and 50-period exponential moving average.
VOL — volume histogram under the candles.
KOL — buy and sell markers for tracked wallets, drawn as avatars on the candle where they traded, plus average KOL entry and exit price lines.
Live price strip
For tokens with a live tick feed, a terminal-style band appears along the bottom of the
token view: INFLOW on the left, a 1-second candle chart in the middle,
and OUTFLOW on the right. Each side lists net flow per event with a
timestamp, so you can watch buying and selling pressure arrive in real time.
Quick Swap panel
The token view includes an embedded swap panel so you can act without leaving the
monitor. Two tabs:
Buy — SOL amount presets (0.1, 0.5, 1, 2, 5, 10) plus a custom input.
Sell — percentage presets (25%, 50%, 100%) of your balance, plus a custom percentage.
Slippage can be Dynamic (recommended), 1%,
3%, or 5%. The gear icon opens settings where you can
change the presets and slippage options to your own numbers. It's the same engine as the
standalone Swap page — same fees, same wallet-linking requirement.
KOL Activity
A per-token feed of tracked wallets' trades: who traded, bought or sold, size in SOL,
the market cap they traded at, realized PnL where the position is closed, and how long
ago it happened.
Sharing an analysis
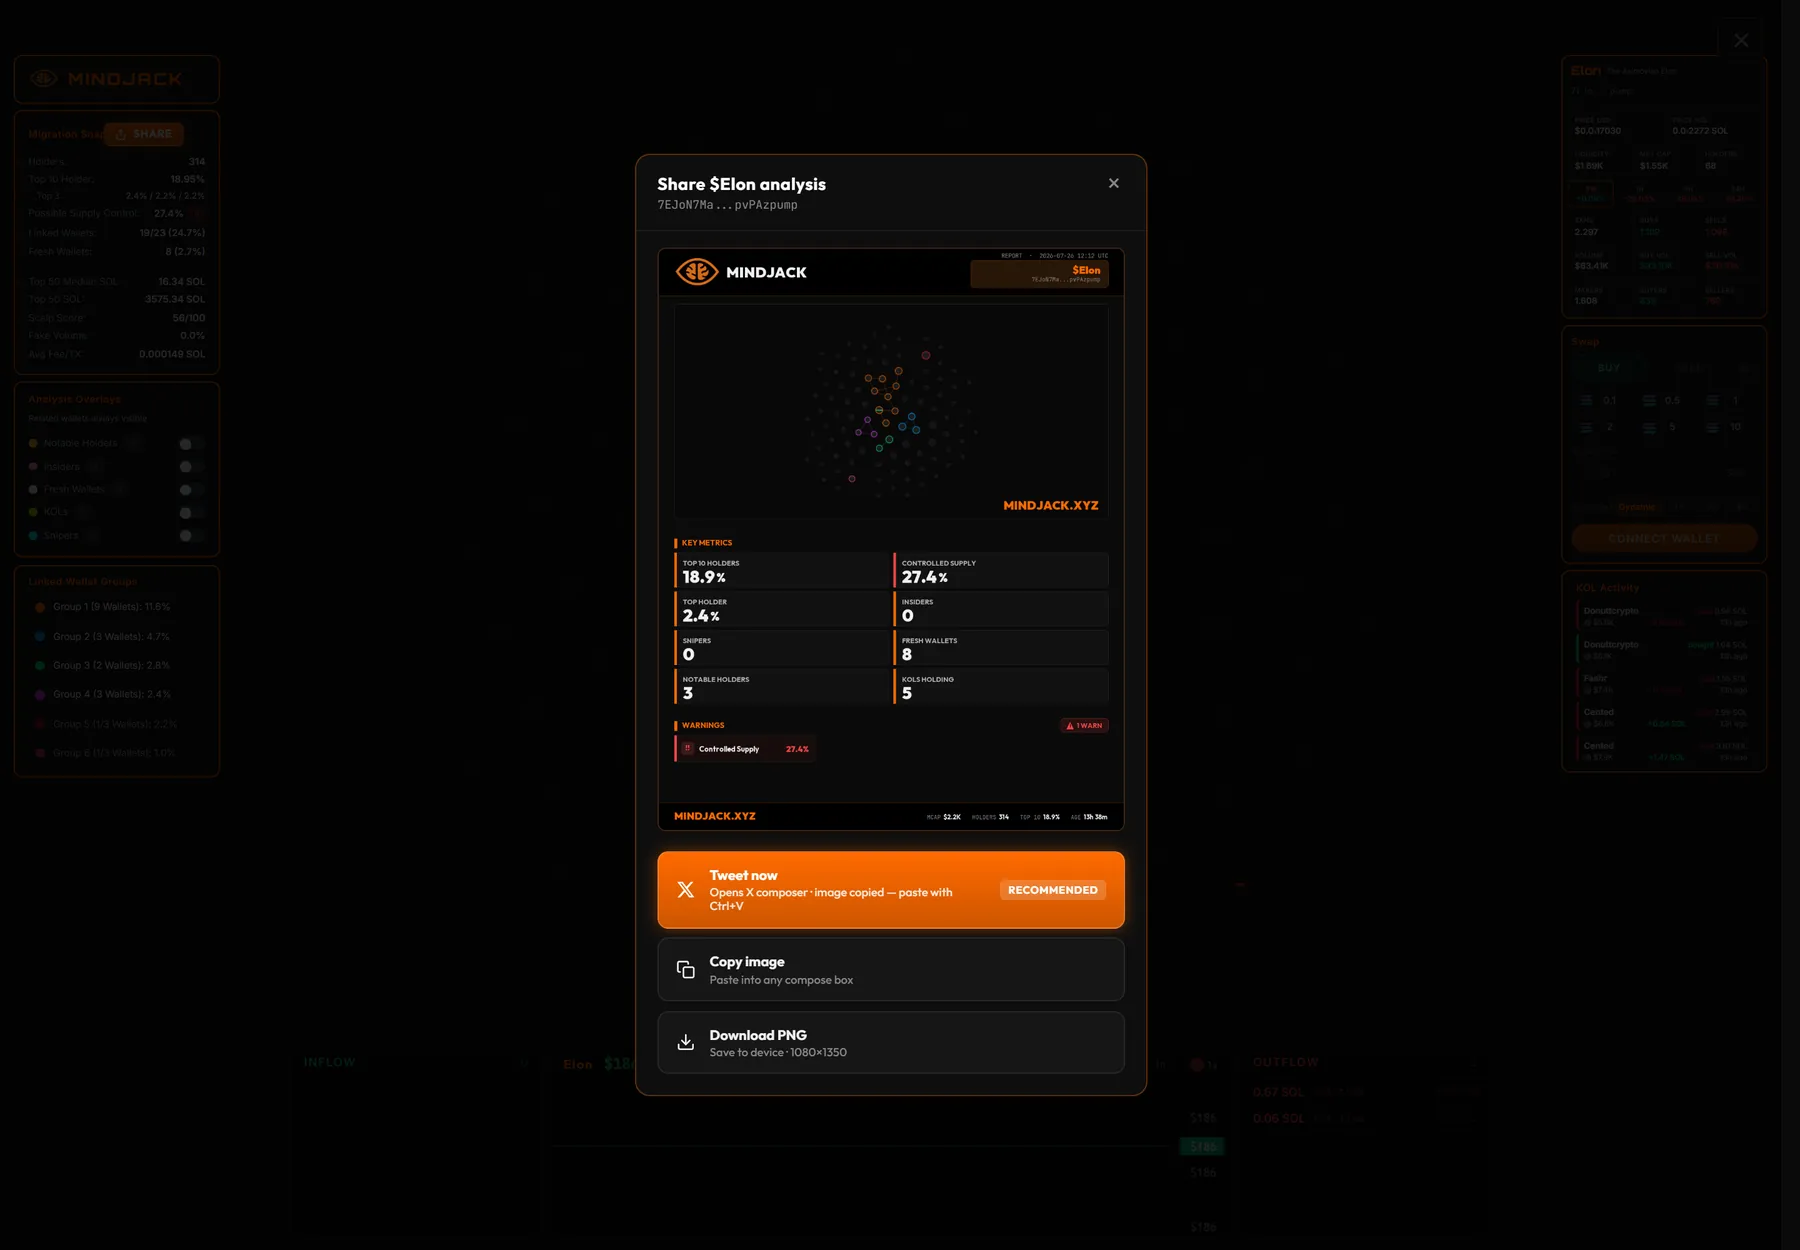
The Share button on the Migration Snapshot builds a 1080×1350 report
card: the bubble graph, key metrics (top 10 holders, controlled supply, top holder,
insiders, snipers, fresh wallets, notable holders, KOLs holding), and any warnings.
The share card is generated on the fly from the current analysis.
Three actions:
Tweet now — opens the X composer with the text prefilled and the image on your clipboard, ready to paste.
Copy image — puts the card on your clipboard for any compose box.
Download PNG — saves it to your device.
If you're signed in, the link in the tweet carries your referral code, so anyone who
signs up through it counts toward your Rewards.
Public token pages
Every analyzed token also has a plain, crawlable summary page at
mindjack.xyz/token/<address>. It carries the headline numbers —
holders, top 10 %, insiders, snipers, fresh wallets, groups, KOLs traded — and links
into the full monitor. It's a lightweight page you can send to someone who doesn't have
an account.
Daily viewing time
Free and anonymous access to the Monitor is capped by a daily viewing-time budget. The
page pings the server every 60 seconds while you're actively using it; idle time (tab in
the background, no interaction) doesn't count. A timer pill shows what's left.
Not logged in: 3 minutes / day
Free: 15 minutes / day
Pro: unlimited
Mindjacker: unlimited
When the budget runs out you're blocked from the page until the next day's reset, and an
upgrade prompt labelled Monitor Access Time points at Pro or higher.
Refreshing a token
The Refresh button at the bottom of the token view fetches a fresh
holder snapshot and re-runs the relationship analysis. The badge on the button shows
your remaining daily quota: Free 5 · Pro 50 · Mindjacker 500.
Connections
Connections takes a single wallet and maps everything it's linked to.
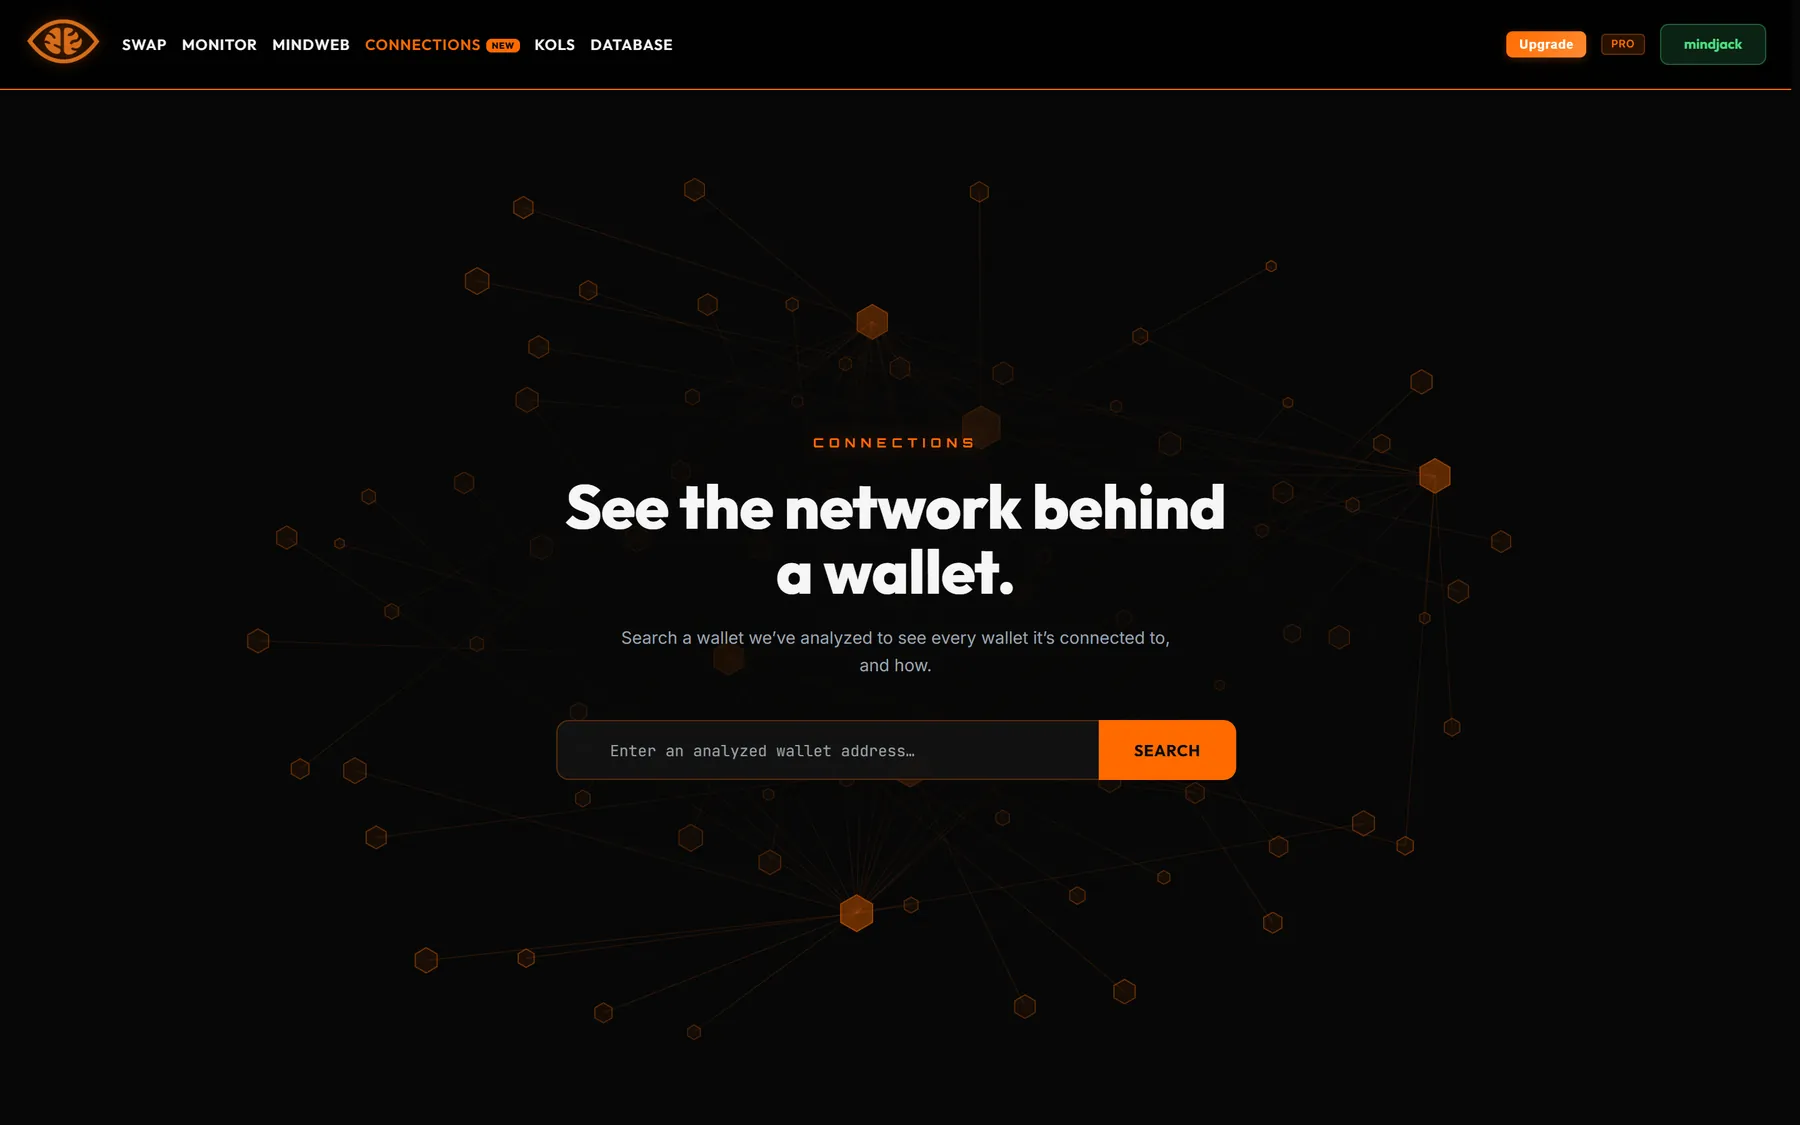
The landing page says it plainly: "Search a wallet we've analyzed to see every
wallet it's connected to, and how."
One box, one wallet address.
Login required
Connections needs an account. Free gets 3 lookups per day with a preview graph; Pro
gets 25 per day with the full graph and indirect links; Mindjacker is unlimited.
The header strip
Above the graph: the wallet's name if we know it, a Tracked KOL badge
where it applies, its SOL and USDC balance, and six counters —
TOKENS (how many analyzed tokens it appears in),
INSIDER, EARLY, FRESH,
GROUPS, and CONNECTED (total wallets in the network).
Wallet Network graph
The searched wallet sits at the centre. Two modes:
Direct — every wallet with a first-degree link to the searched wallet.
Indirect links — expands the map two hops out, so you can see the network behind the network. Pro and above.
Next to the mode switch, All / In / Out filters by transfer direction
with a count on each chip. The three icon buttons on the right go fullscreen (Esc to
exit), fit the graph back into view, and freeze the layout so nodes stop drifting while
you read.
Link types
Four coloured chips filter the graph by how each link was formed:
Bundle — co-bundled: bought together in the same launch transaction
Transfer — a direct SOL or token transfer between the two wallets
Funding — funded from the same source, or through a relay/mixer
Concentration — early buyers that together hold a high, concentrated share of supply
The Min shared tokens slider hides weak links: raise it and only wallets
that overlap with the searched wallet across several tokens stay on screen. The graph
legend also marks Hub, Mixer, and
Funding source nodes.
Data tabs
The right-hand panel is the same network in table form, with a count on each tab:
Seen In — every analyzed token this wallet holds, with supply share and holder rank.
Insider — tokens where it was flagged as an insider, with SOL invested and profit.
Early — tokens where it was an early-window buyer, with its rank and first buy size.
Groups — linked-wallet groups it belongs to, with group size and supply share.
Relationships — the connected wallets themselves, with the token the link was found on, the relationship type, and an In/Out badge on directional transfers.
Transfer direction is only meaningful for direct SOL and token transfers, so the In/Out
badge only appears on those rows. Other relationship types are undirected by nature.
Mindweb
The Mindweb page subtitle says it best: "Reveals which tokens are created by the
same groups and lets you explore the links between them." It's a network graph
where the nodes are tokens and the edges are shared wallets connecting them.
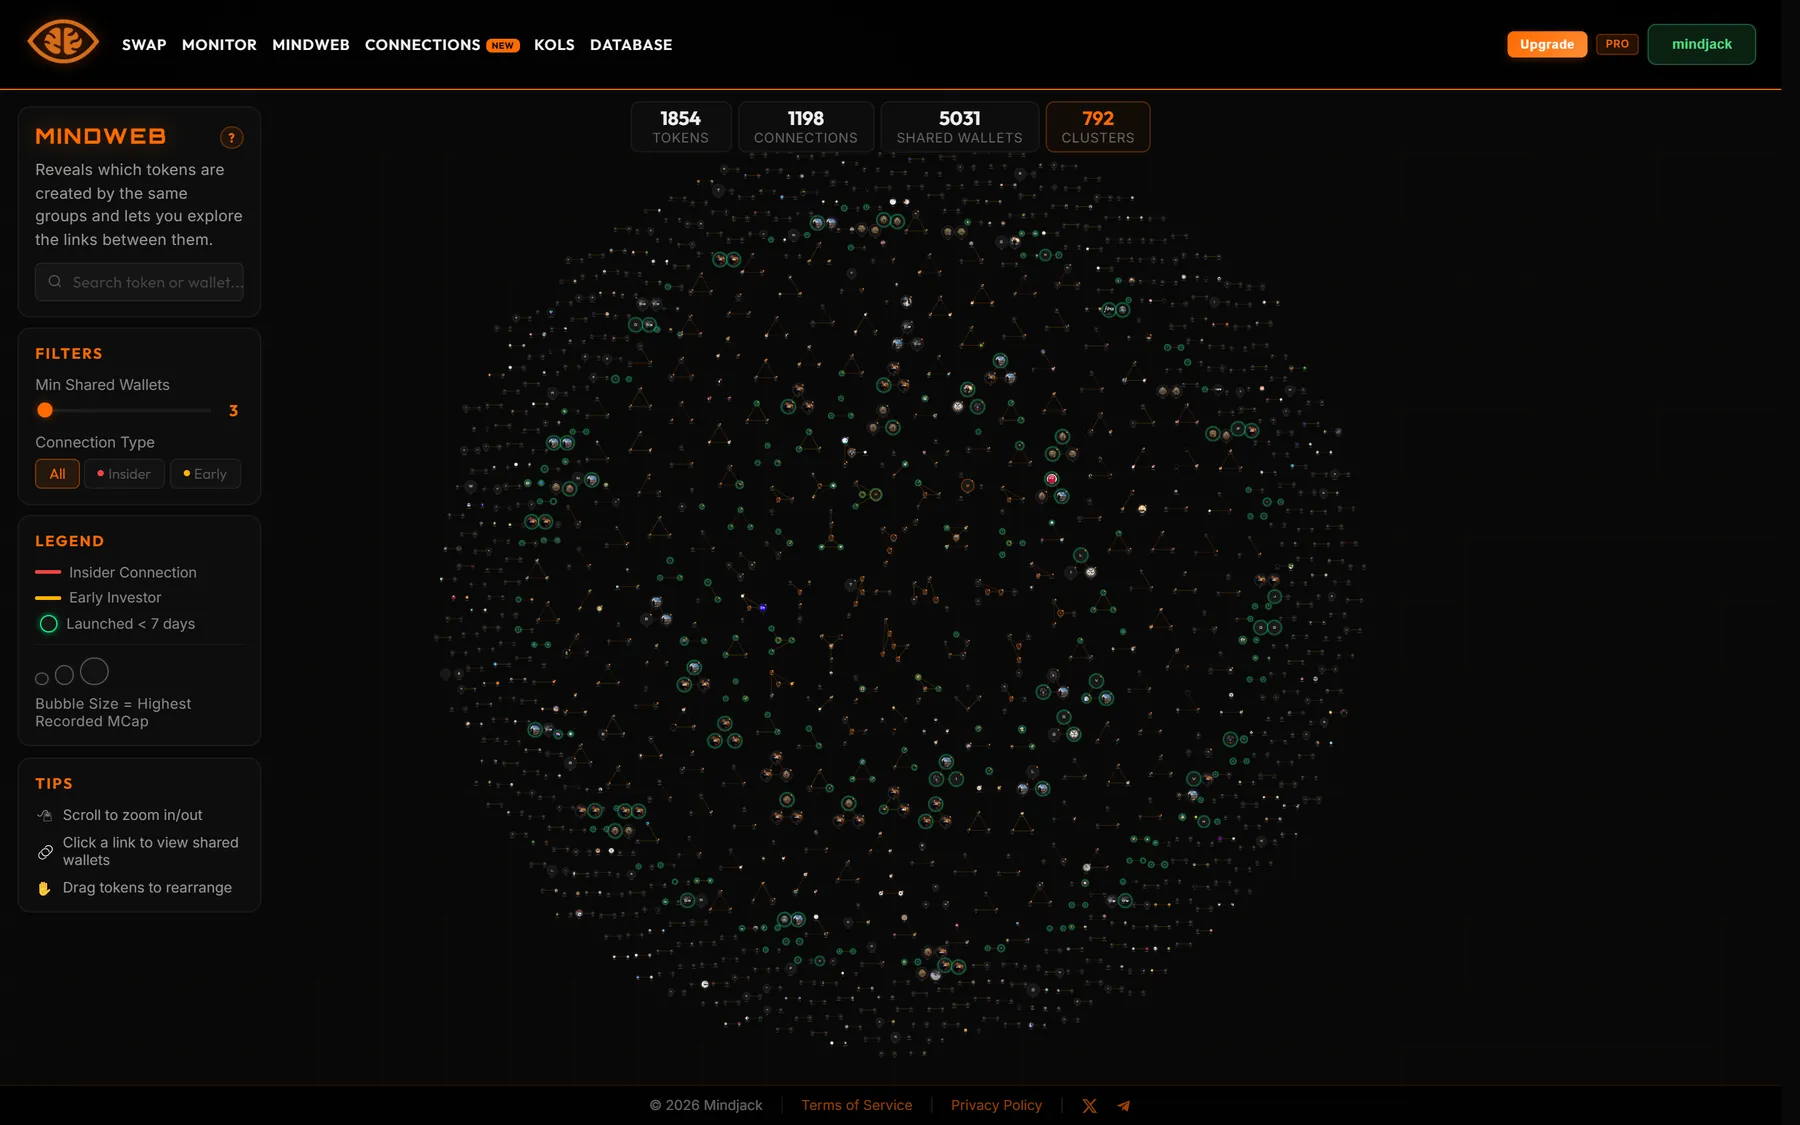
Every dot is a token; every line means the two share wallets.
Use it to spot token clusters — groups of launches that share insiders or early
investors. Useful for catching serial launchers before their next one takes off.
Top stats
Four counters across the top: Tokens, Connections,
Shared Wallets, and Clusters. They update as you change
the filters, so they always describe what's currently on screen.
Filters
Search — find a specific token or wallet in the graph.
Min Shared Wallets — a slider that hides connections weaker than the threshold. Raise it to strip the graph down to the strongest links.
Connection Type — limit edges to All, Insider, or Early investor connections.
Legend
Insider Connection (red edge) — the two tokens share insider wallets.
Early Investor (amber edge) — the two tokens share early-window buyers.
Launched < 7 days (green ring) — a recent launch.
Bubble size — the token's highest recorded market cap.
Getting around
Scroll to zoom, drag tokens to rearrange the layout, and click the background at any
point to clear your selection and bring the whole graph back.
Hovering a token
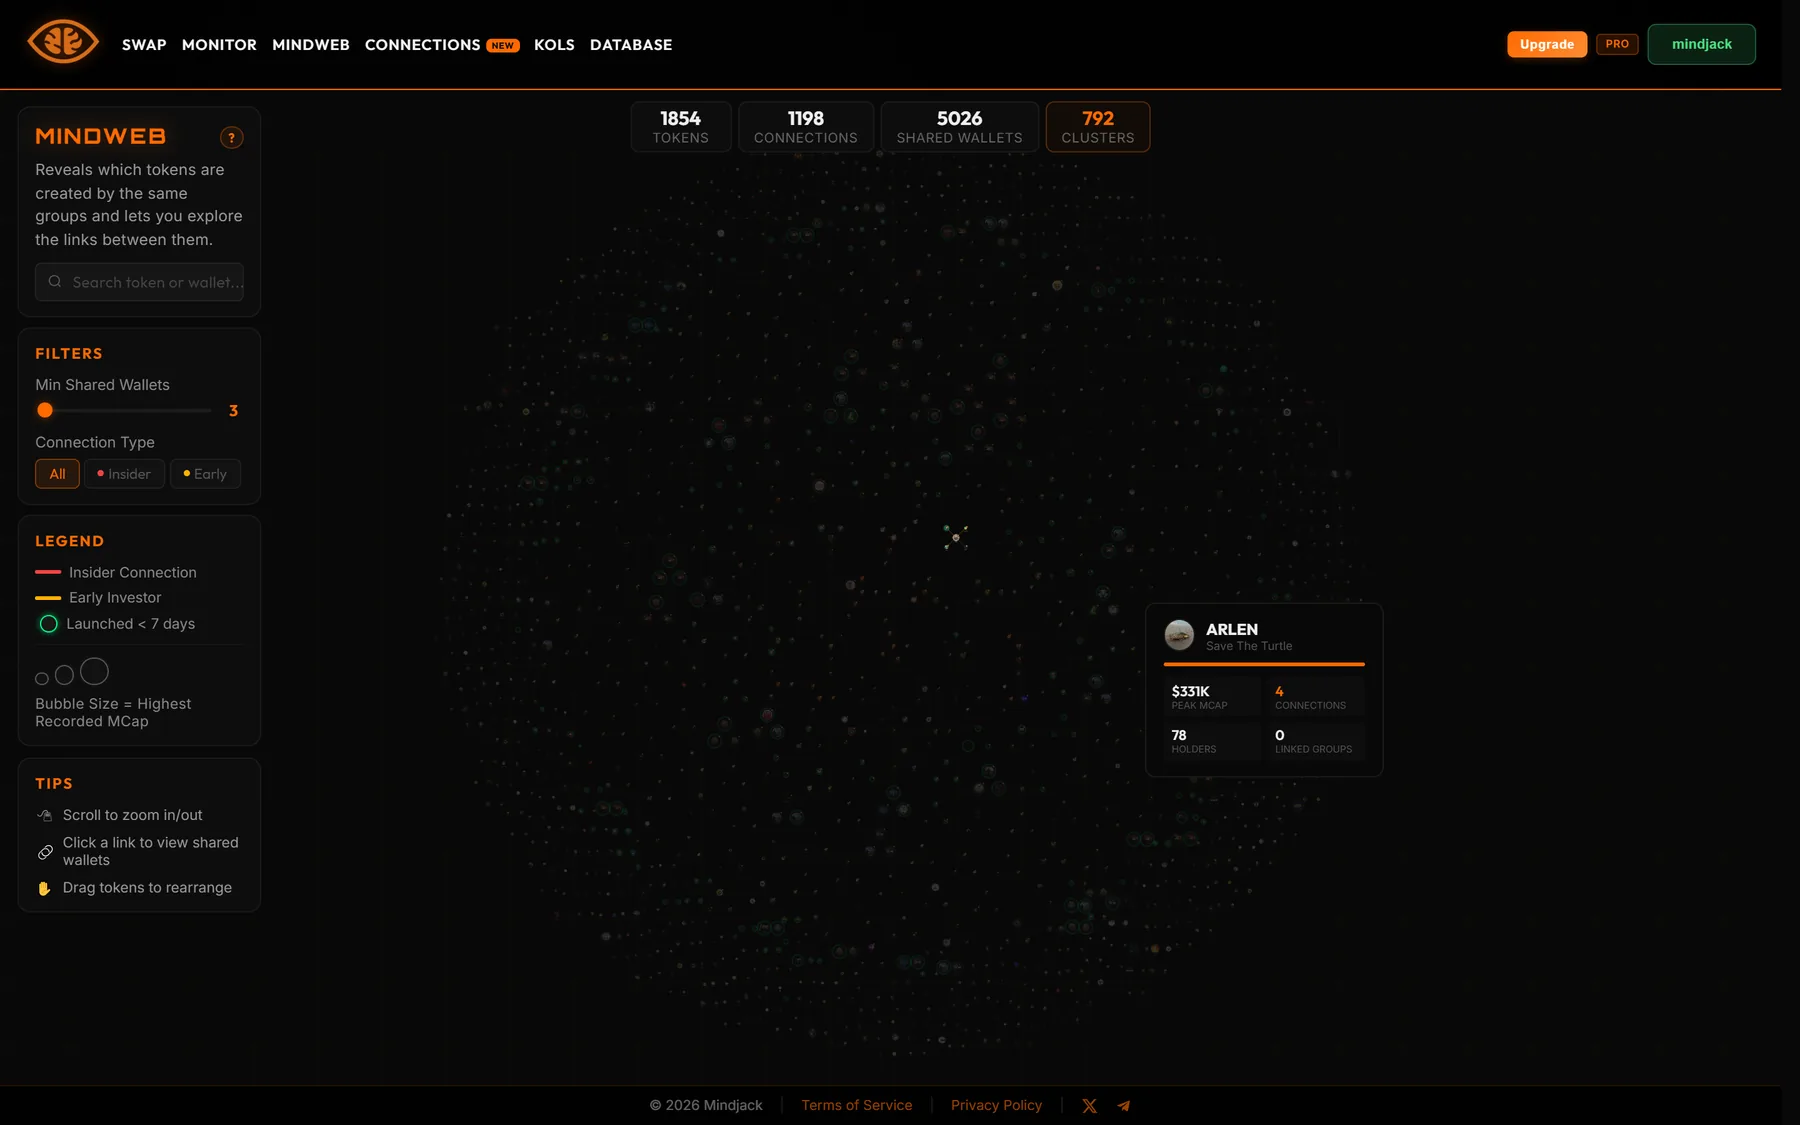
Hover any bubble for a quick card: the token's logo, symbol and name, a bar showing how
well-connected it is relative to the busiest token on the graph, and four numbers —
Peak MCap, Connections, Holders, and
Linked Groups. It's enough to decide whether a bubble is worth clicking
without leaving the map.
Token hover card, with the connection-strength bar under the name.
Clicking a token
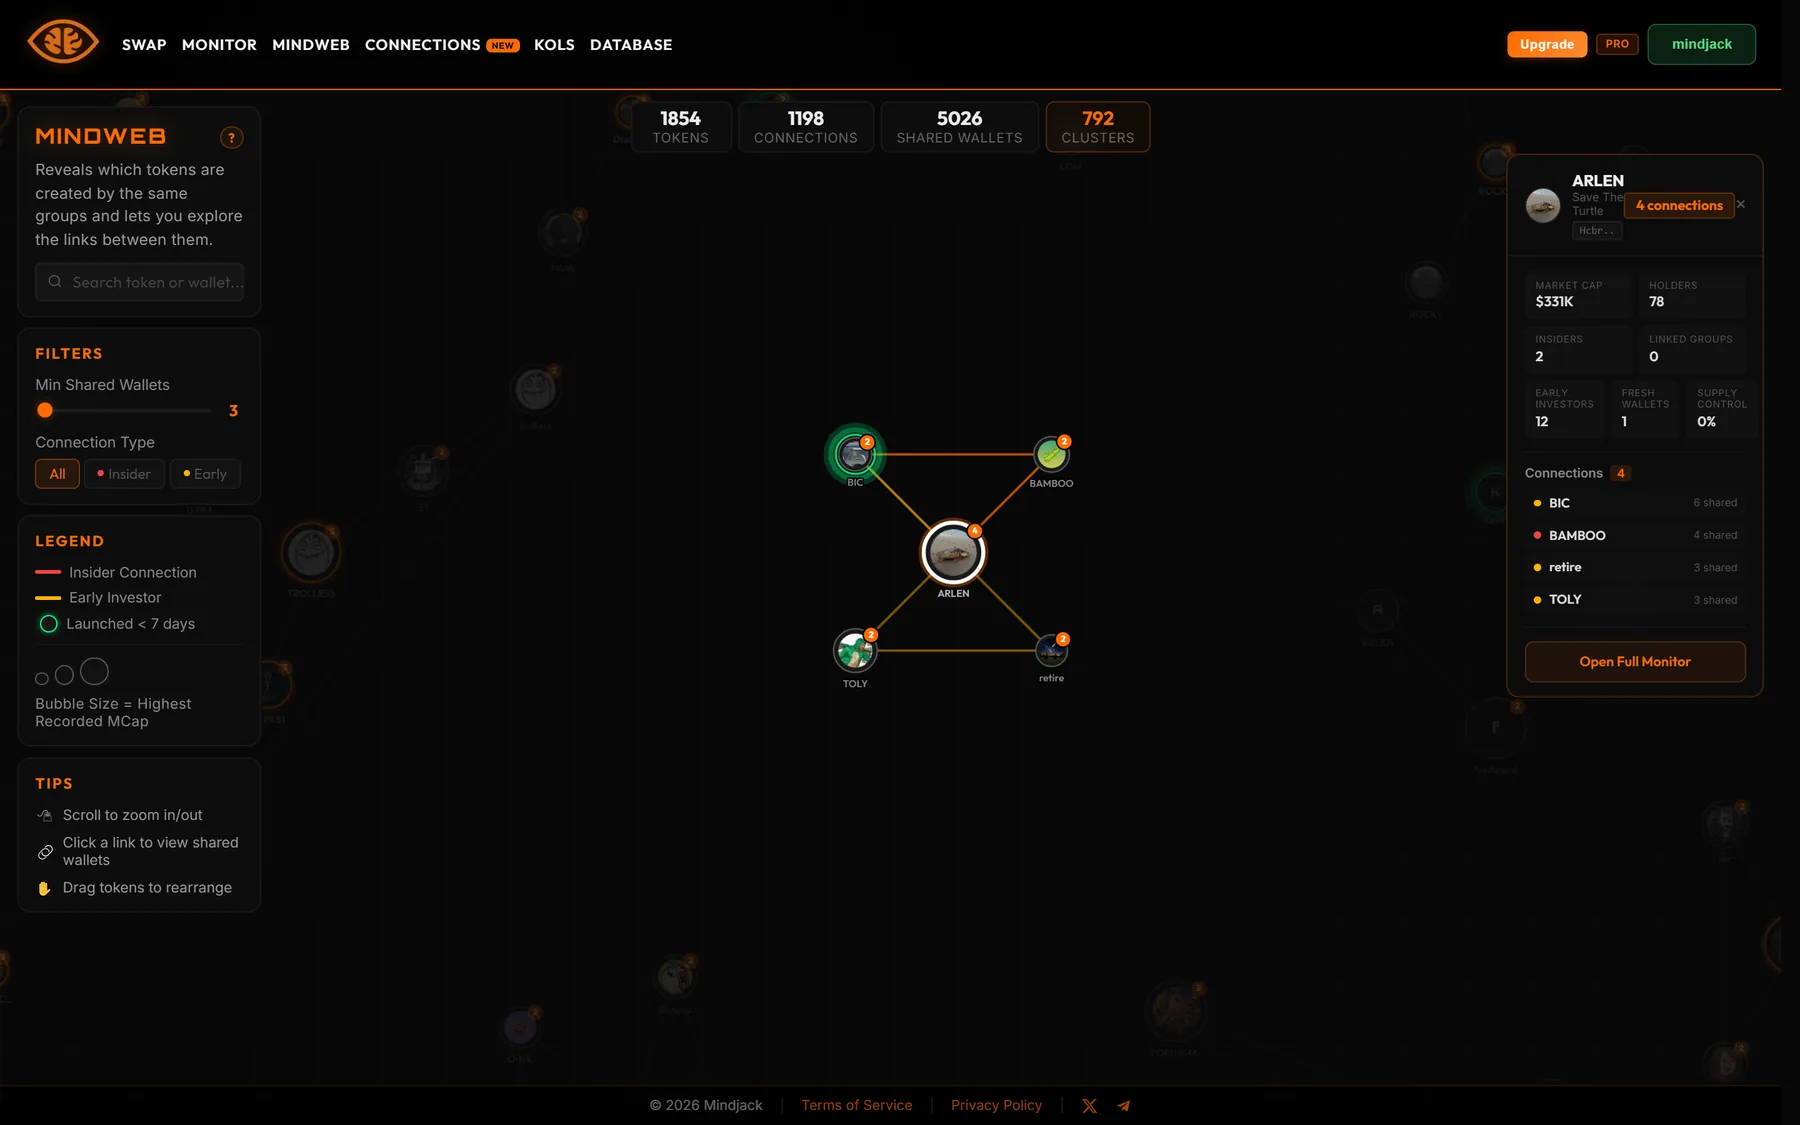
Click a bubble and Mindweb lights up its entire connected component — not just
its direct neighbours, but every token chained to it — and dims everything else. If a
token belongs to a cluster of serial launches, that's the moment you see the whole
cluster at once.
Clicking a token dims the rest of the graph and opens its detail panel.
The panel that opens carries:
Logo, symbol, name, and the contract address — click it to copy
A connection count badge
Market Cap, Holders, Insiders, Linked Groups, Early Investors, Fresh Wallets, Supply Control
Connections — every token it's linked to, colour-dotted by connection type, with the number of wallets shared. Click a row to walk to that token's panel and keep tracing the cluster.
Open Full Monitor — jumps to that token's full analysis
Hovering and clicking a link
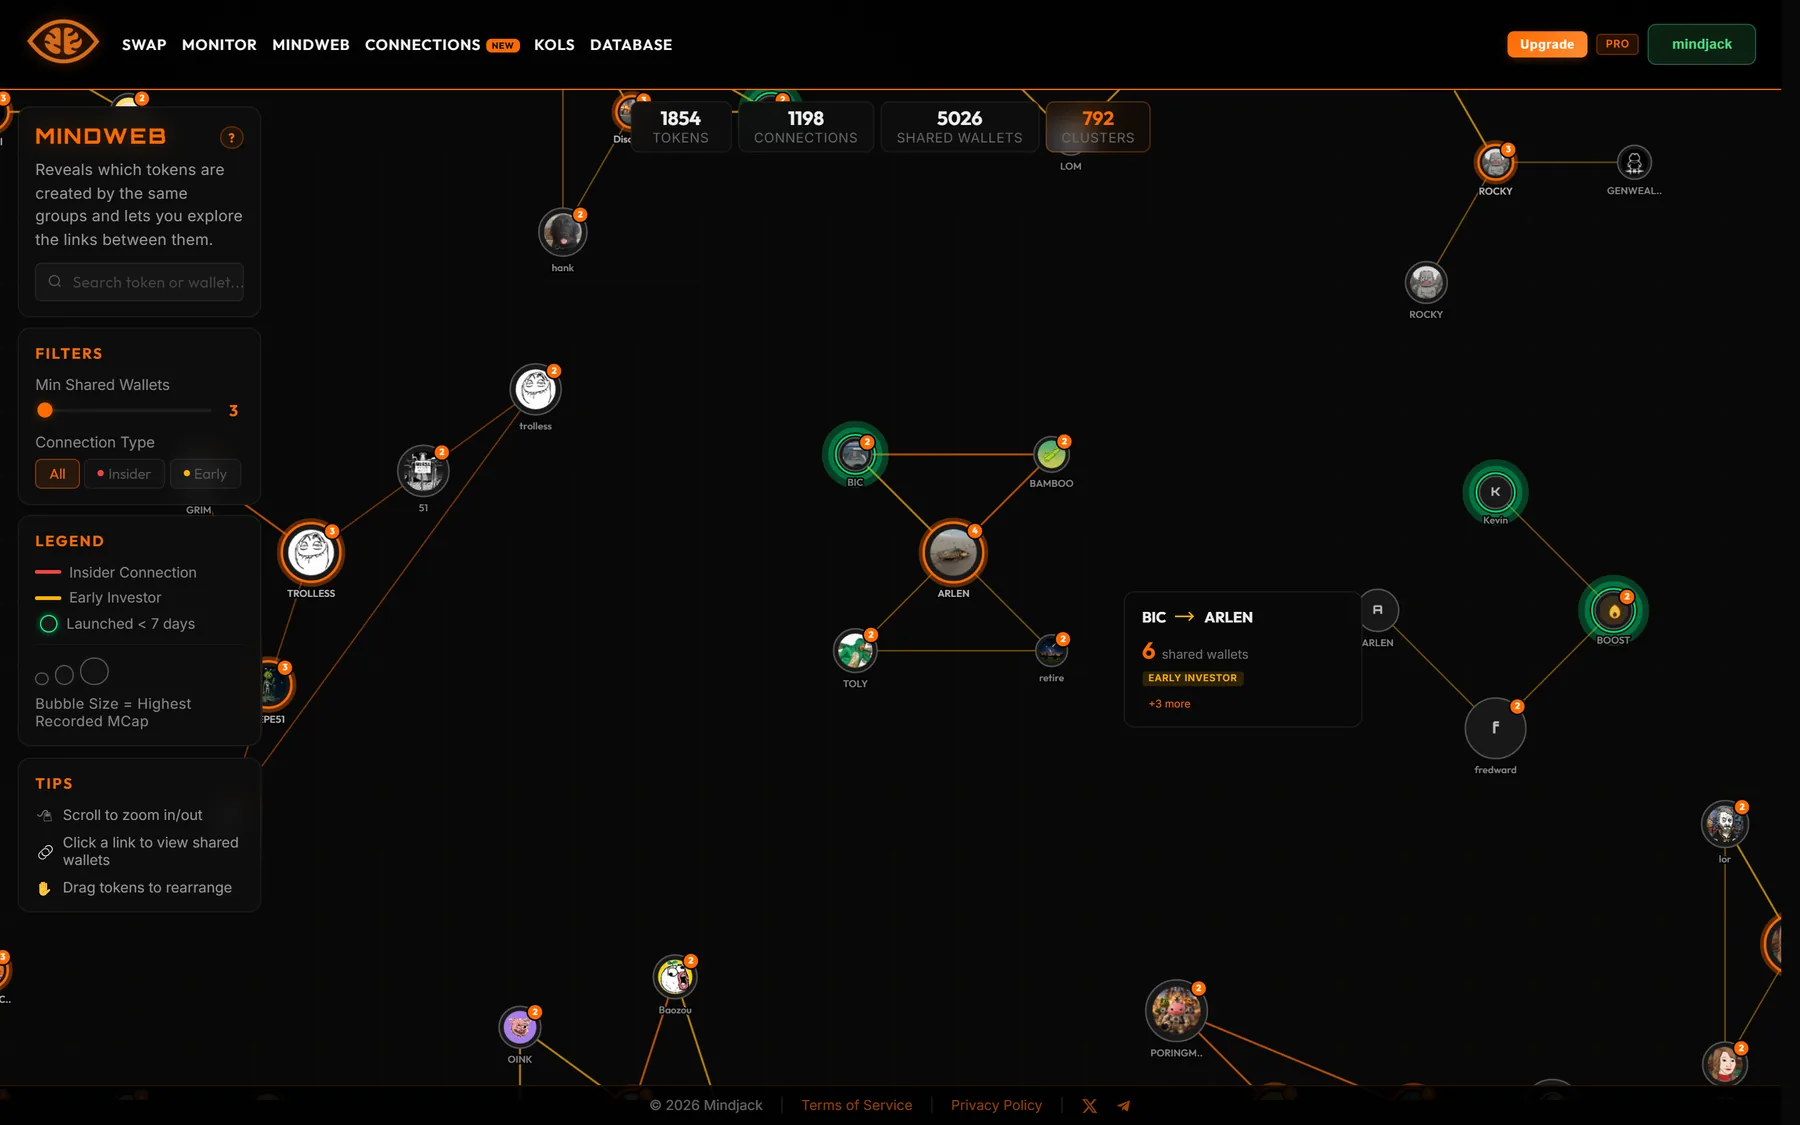
The lines are the point of Mindweb. Hover one and you get a small card: the two token
symbols, how many wallets they share, and whether the link is
INSIDER or EARLY INVESTOR — enough to judge a link
without committing to it.
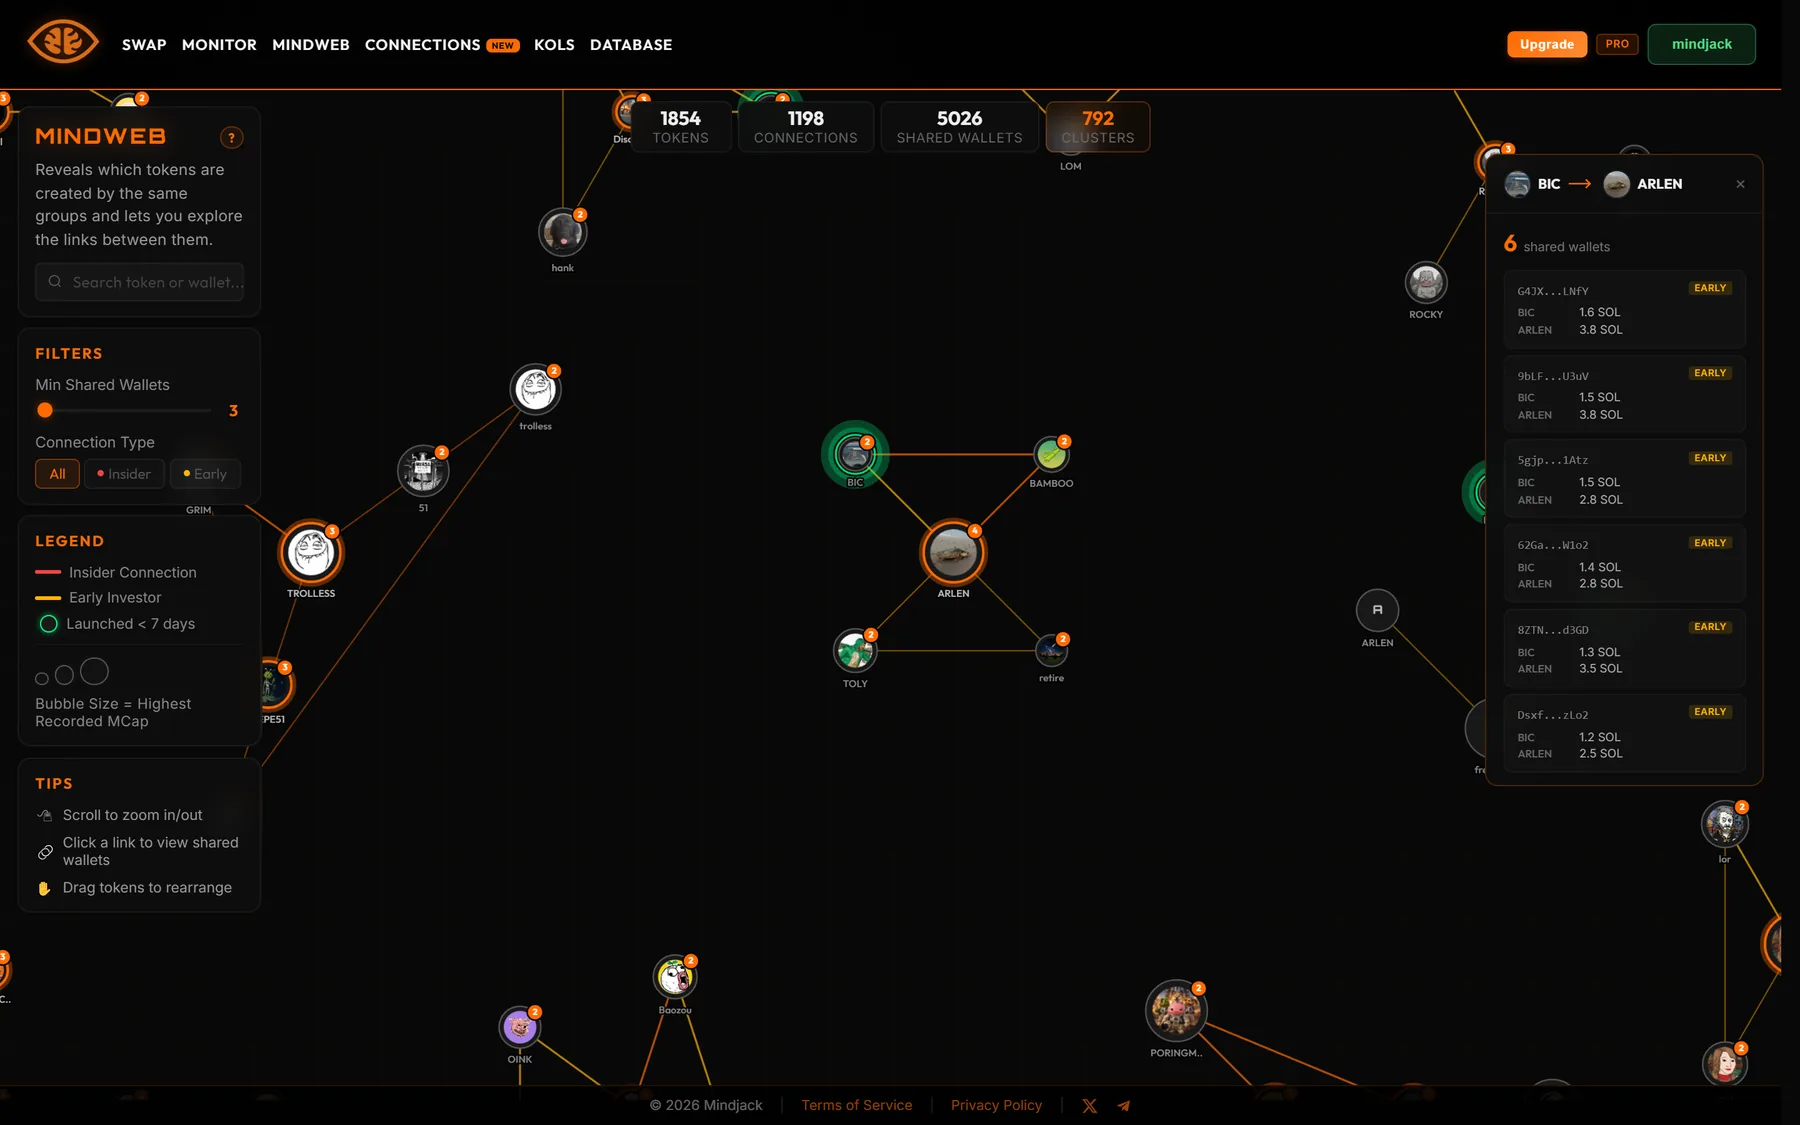
Link hover: the token pair, how many wallets they share, and the type of link.
Click the link and the full detail panel opens with both token logos side by side and the
complete list of shared wallets. Each row shows the wallet, role badges
(EARLY / INSIDER), and how much it put into
each of the two tokens — which is what turns "these tokens are related" into
"this specific wallet funded both launches at this size."
Link detail: every wallet the two tokens have in common, with its role and size in each.
Pro and above
Anyone can open Mindweb, explore the graph, hover tokens, and see how many wallets any
two tokens share. The wallet addresses themselves — the list behind a link — are
unlocked on Pro and Mindjacker; on Free they render blurred behind an upgrade prompt.
KOL Tracker
"Track top-performing Key Opinion Leaders in Solana ecosystem. Real-time wallet
monitoring · Performance analytics · Alpha discovery." Public — anyone can browse it.
Live Trading Feed
The main panel is a real-time feed of trades from tracked wallets, marked
LIVE while streaming. Each row shows the KOL, a position state chip
(New Position, Partial, or Closed),
the side, size in SOL, the token, the market cap it traded at, and — on exits — the
realized PnL and how long the position was held.
Instant Trade
The lightning icon on each row copies that KOL's buy in a single click. Set your default
SOL amount in the input next to the feed header (0.1 by default). Requires a connected
wallet, same as the swap page.
Stats overview
Four cards under the feed:
Tracked KOLs — how many wallets are being monitored
Avg Win Rate — average success rate across tracked wallets
Total Profit (7d) — aggregate profit over the last week
Daily Trades — trade count today, with the change vs yesterday
Top Performers leaderboard
Below the stats, with two view modes:
Cards — visual cards with avatar, handle, and headline stats.
List — table view: #, Trader, Profit, Win%, Trades, Median Hold, Avg Entry.
Sort by Total Profit, Win Rate, or
Median Hold Time, and filter to 1 Day,
7 Days (default), 14 Days, or 30 Days.
There's also a search box for finding a specific name or wallet.
The profile modal
Click any KOL — on a leaderboard card, a list row, or a line in the live feed — and their
full profile opens over the page.
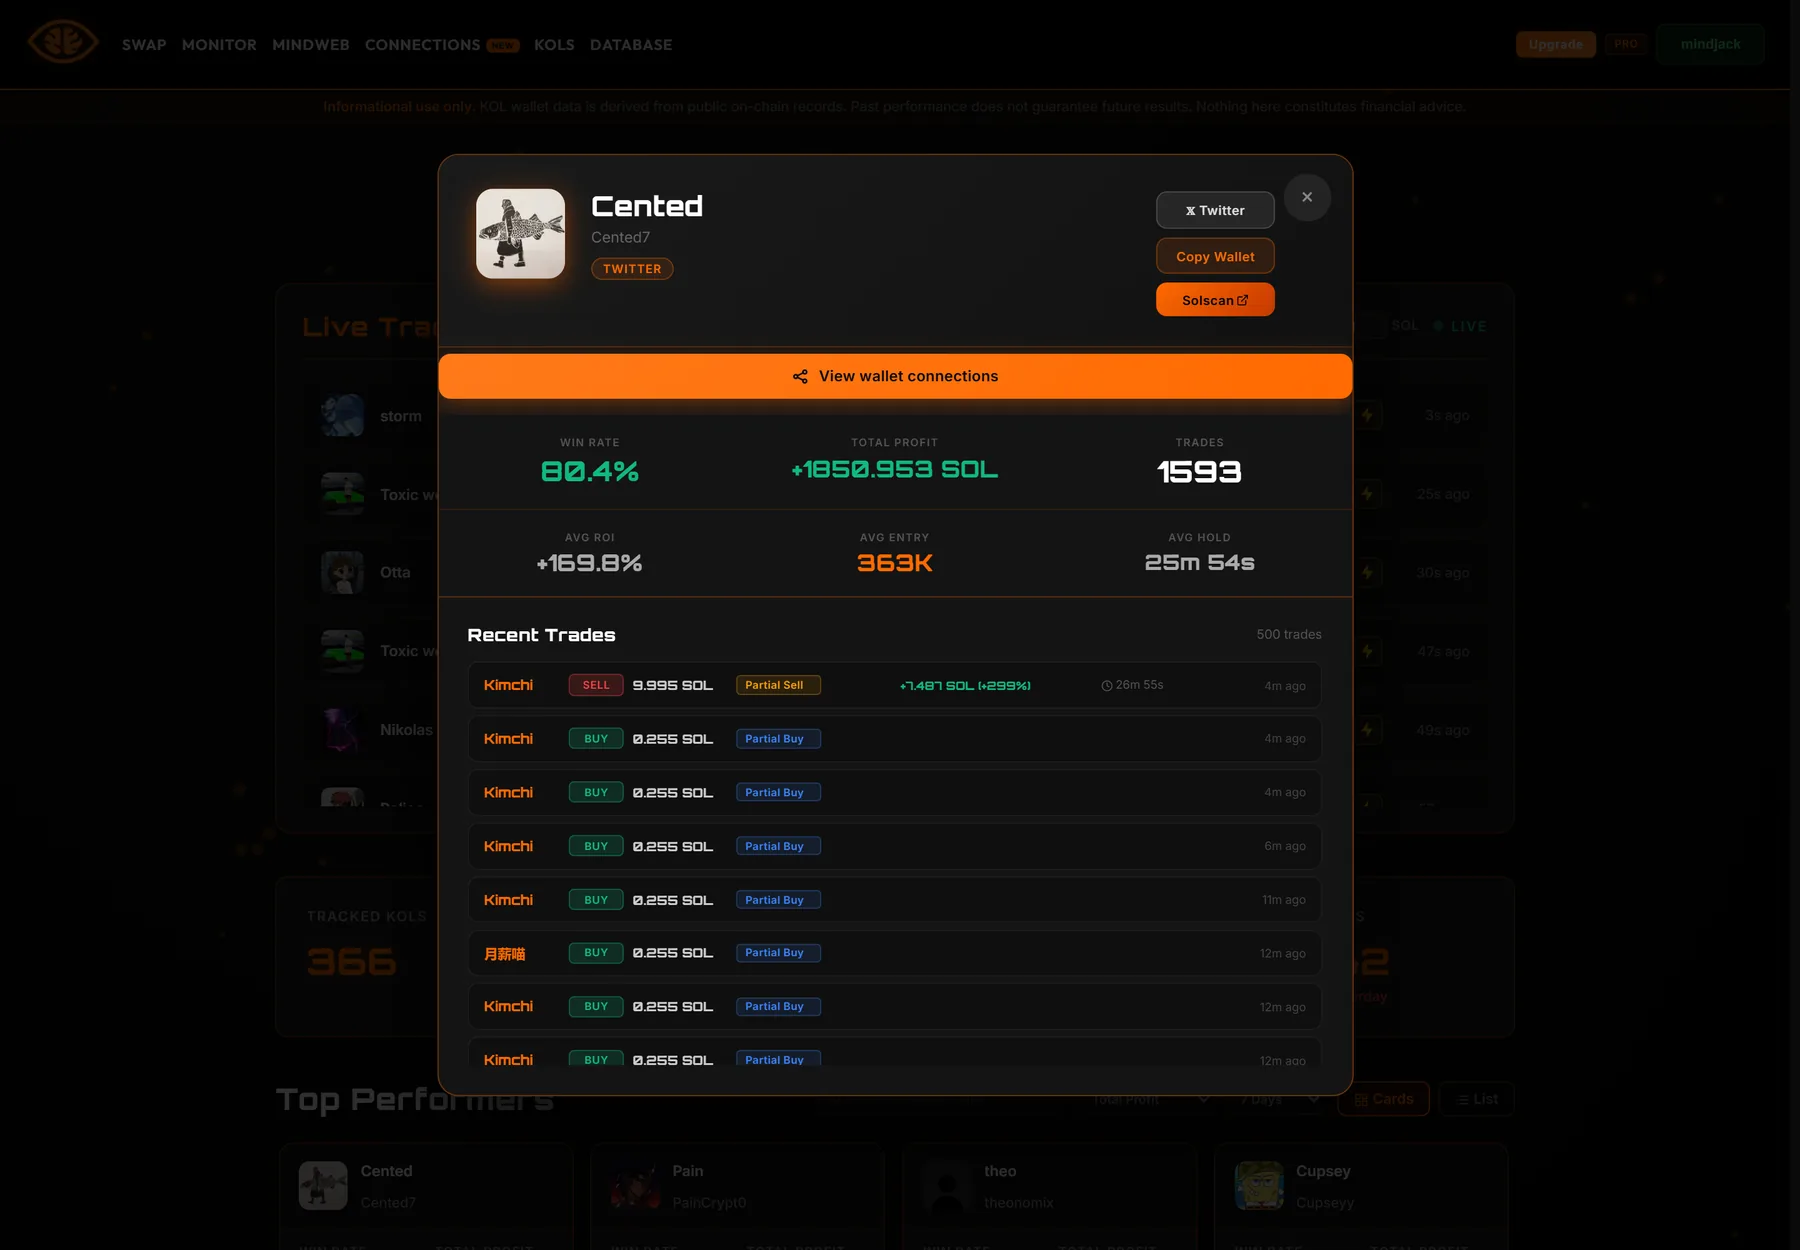
A KOL profile: identity, links, performance, and the full recent trade history.
Top of the modal:
Avatar, display name, social handle, and a Verified chip where it applies
Buttons out to Twitter, Copy Wallet, and Solscan
View wallet connections — opens this wallet in Connections
Then six performance boxes, all for the time window selected on the leaderboard:
Win Rate — share of closed positions in profit
Total Profit — realized PnL in SOL
Trades — number of trades in the window
Avg ROI — average return per closed position
Avg Entry — the market cap they typically buy at. A trader who enters at 30K is playing a different game from one who enters at 3M.
Median Hold — how long they typically stay in
Recent Trades
Below the stats, every recent trade as its own row:
Token symbol, linked through to a swap for that token
BUY or SELL and the size in SOL
A position chip — New Position, Partial Buy, Partial Sell, or Closed — so you can tell an entry from a scale-in and a trim from a full exit
On exits: realized PnL in SOL with the ROI percentage, and how long the position was held
How long ago it happened
A "Closed" row with a big number is the eye-catching one, but the pattern matters more:
a wallet that scales in with repeated Partial Buys and trims on the way up behaves very
differently from one that dumps a whole position in a single Closed row.
Daily viewing time
Free and anonymous access is capped by a daily viewing-time budget, tracked the same way
as the Monitor — 60-second heartbeats, idle time excluded.
Not logged in: 3 minutes / day
Free: 15 minutes / day
Pro: unlimited
Mindjacker: unlimited
Disclaimer (shown on the page)
"Informational use only. KOL wallet data is derived from public on-chain records.
Past performance does not guarantee future results. Nothing here constitutes
financial advice."
Database
Where the Monitor shows one token, the Database is the ecosystem-wide view across
everything Mindjack has ever analyzed. Its subtitle: "Search any Solana token or
wallet address to explore full on-chain analysis data."
A stats bar sits under the mode switcher on every mode: TOKENS ANALYZED,
WALLETS TRACKED, INSIDERS FOUND,
FRESH WALLETS, LINKED GROUPS.
The buttons at the top switch between five different views of the same dataset:
Search, Compare, Serial Insiders,
Funder Networks, and Clusters.
Search
One box: paste a token address, a wallet address, or a symbol. Token results open the
full analysis; wallet results open a profile with tabs for holdings, insider flags,
early-investor flags, groups, and relationships.
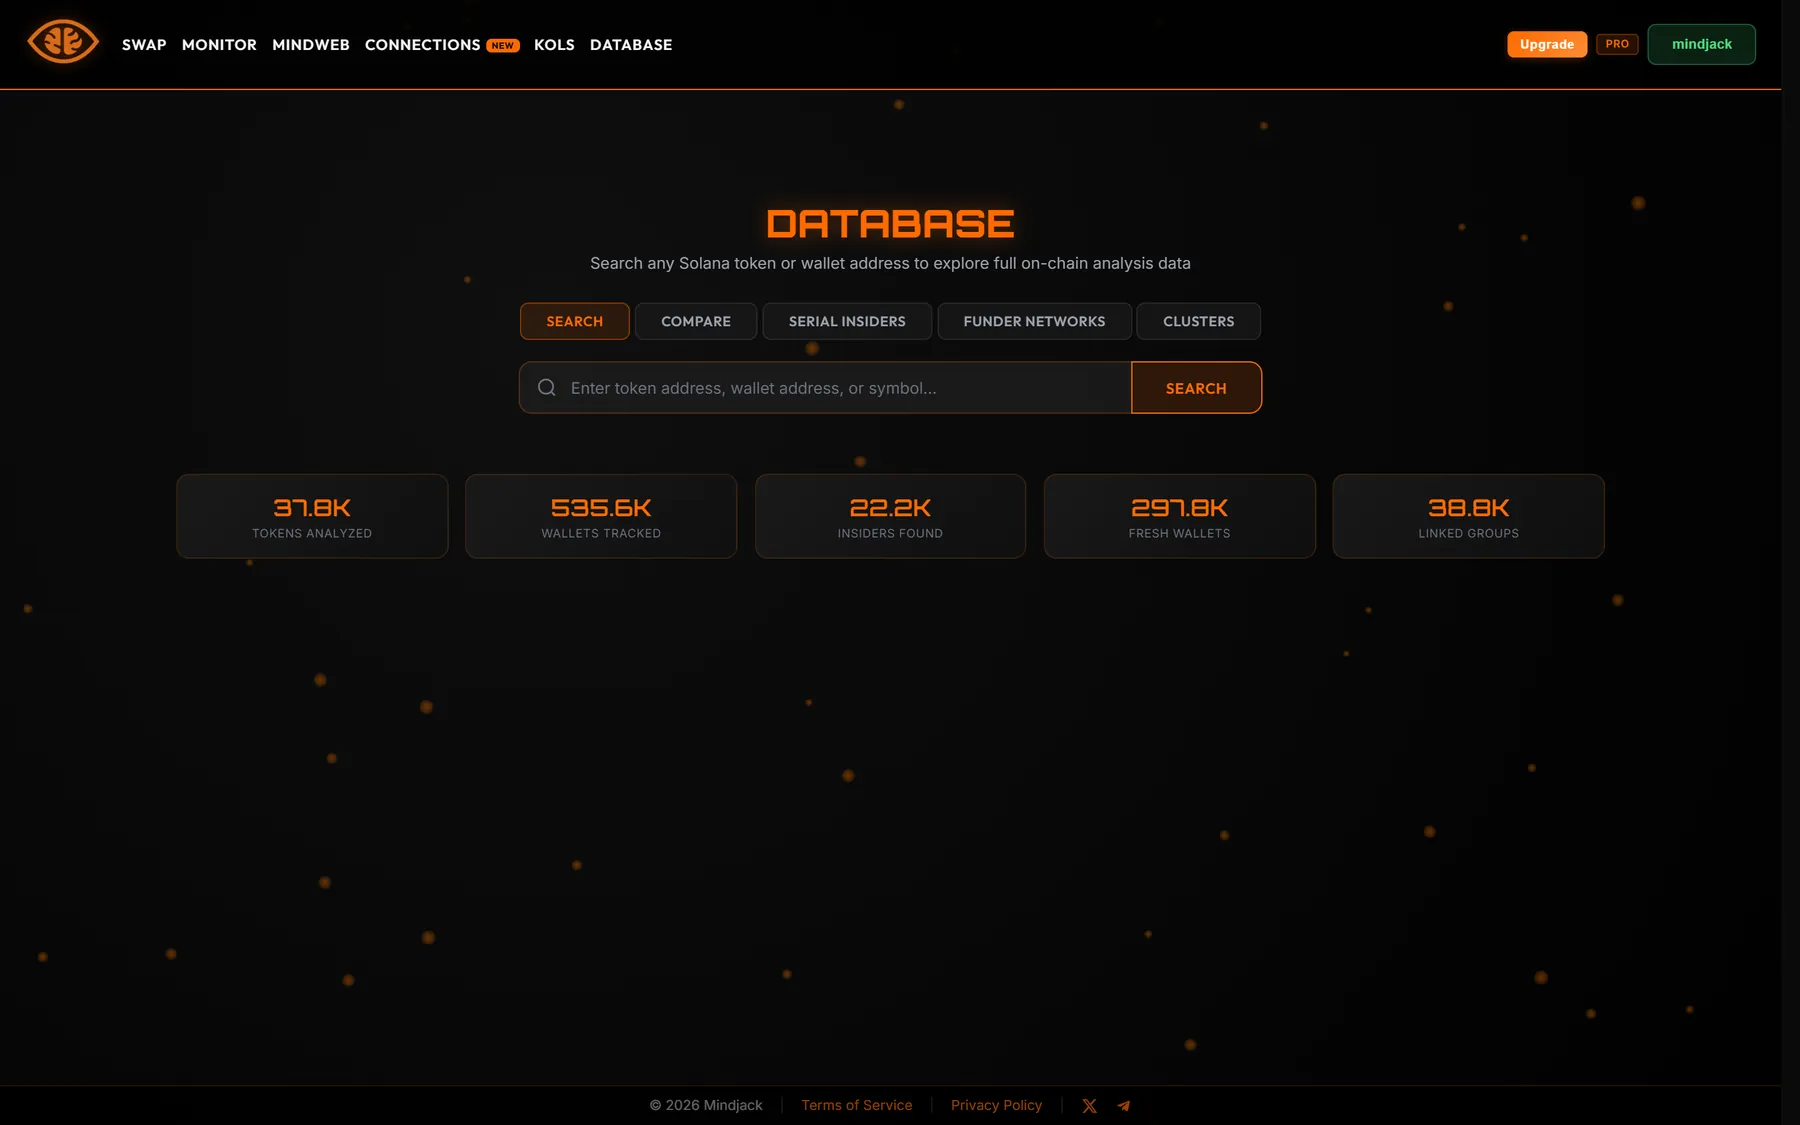
Search mode, with the platform-wide totals underneath.
Compare
Put two or more addresses side by side and see what they have in common. The
Tokens / Wallets switch picks what you're comparing;
the + button adds another slot.
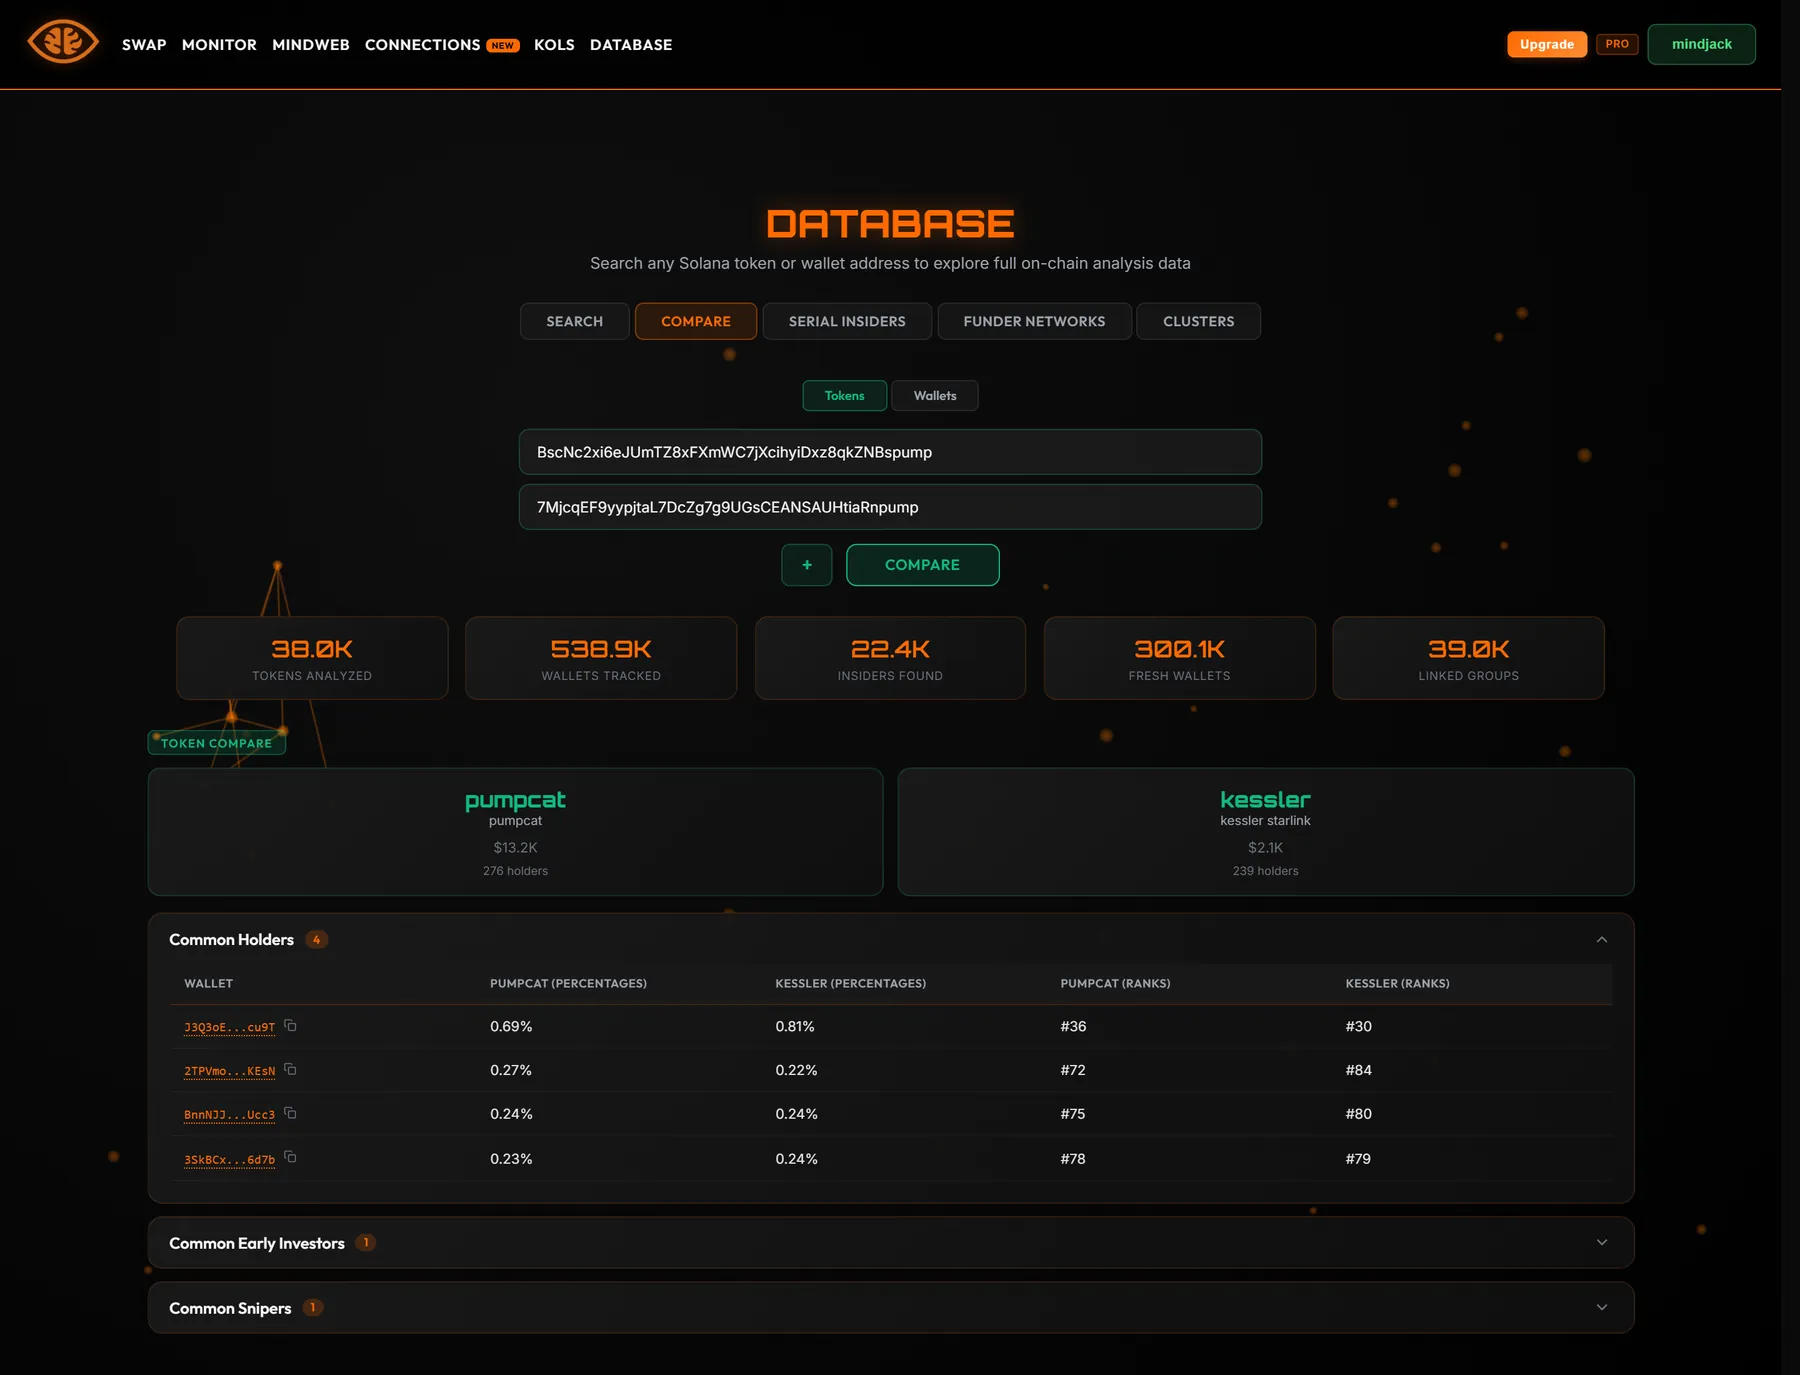
For tokens the result is grouped into collapsible sections — Common Holders,
Common Insiders, Common Early Investors,
Common Group Members, Common Fresh Wallets,
Common Snipers — each showing the wallet, its share of supply, and its
holder rank in each token. It's the fastest way to confirm "this is the same crew
rotating into a new launch."
Two unrelated-looking launches sharing four holders, an early investor, and a sniper.
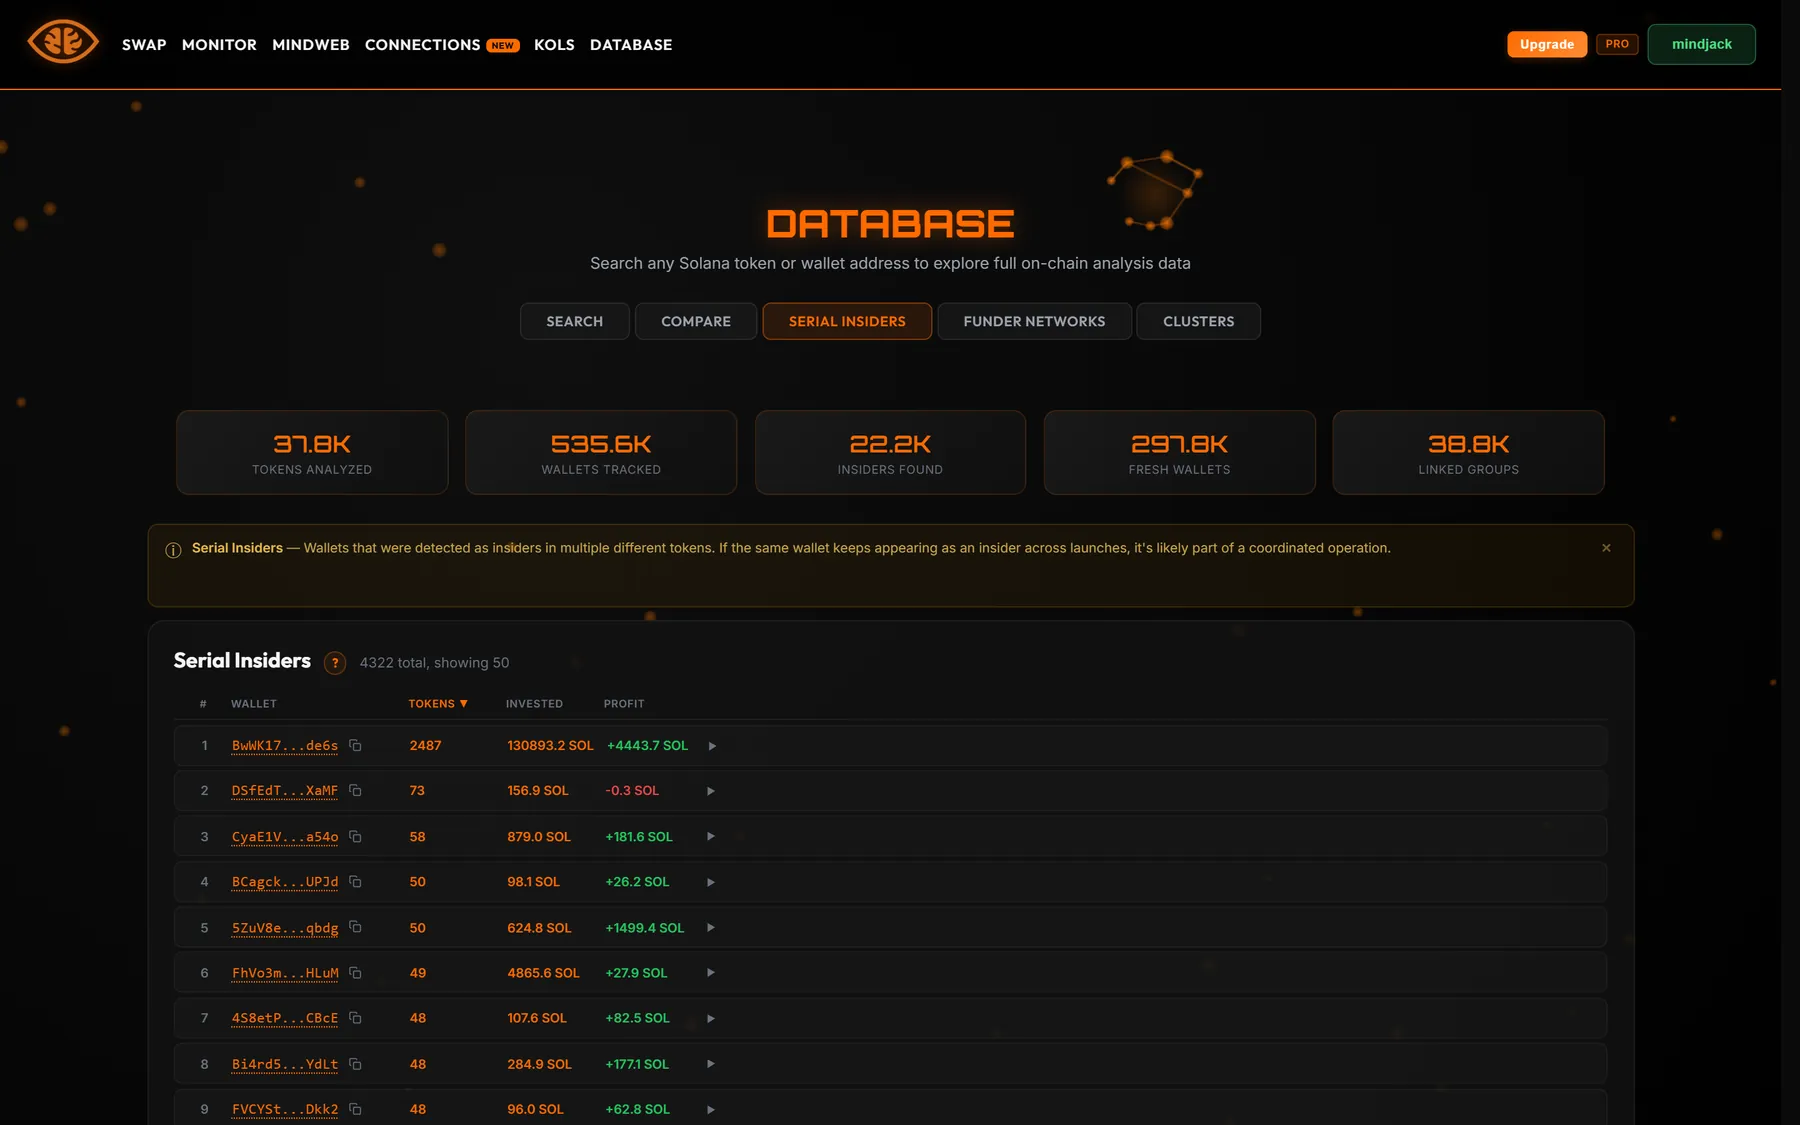
Serial Insiders
As the page explains: "Wallets that were detected as insiders in multiple different
tokens. If the same wallet keeps appearing as an insider across launches, it's likely
part of a coordinated operation." The table ranks them by how many tokens they've
been flagged in, with total SOL invested and profit. Expand a row to see the tokens.
Serial insiders, ranked by how many launches they've been flagged in.
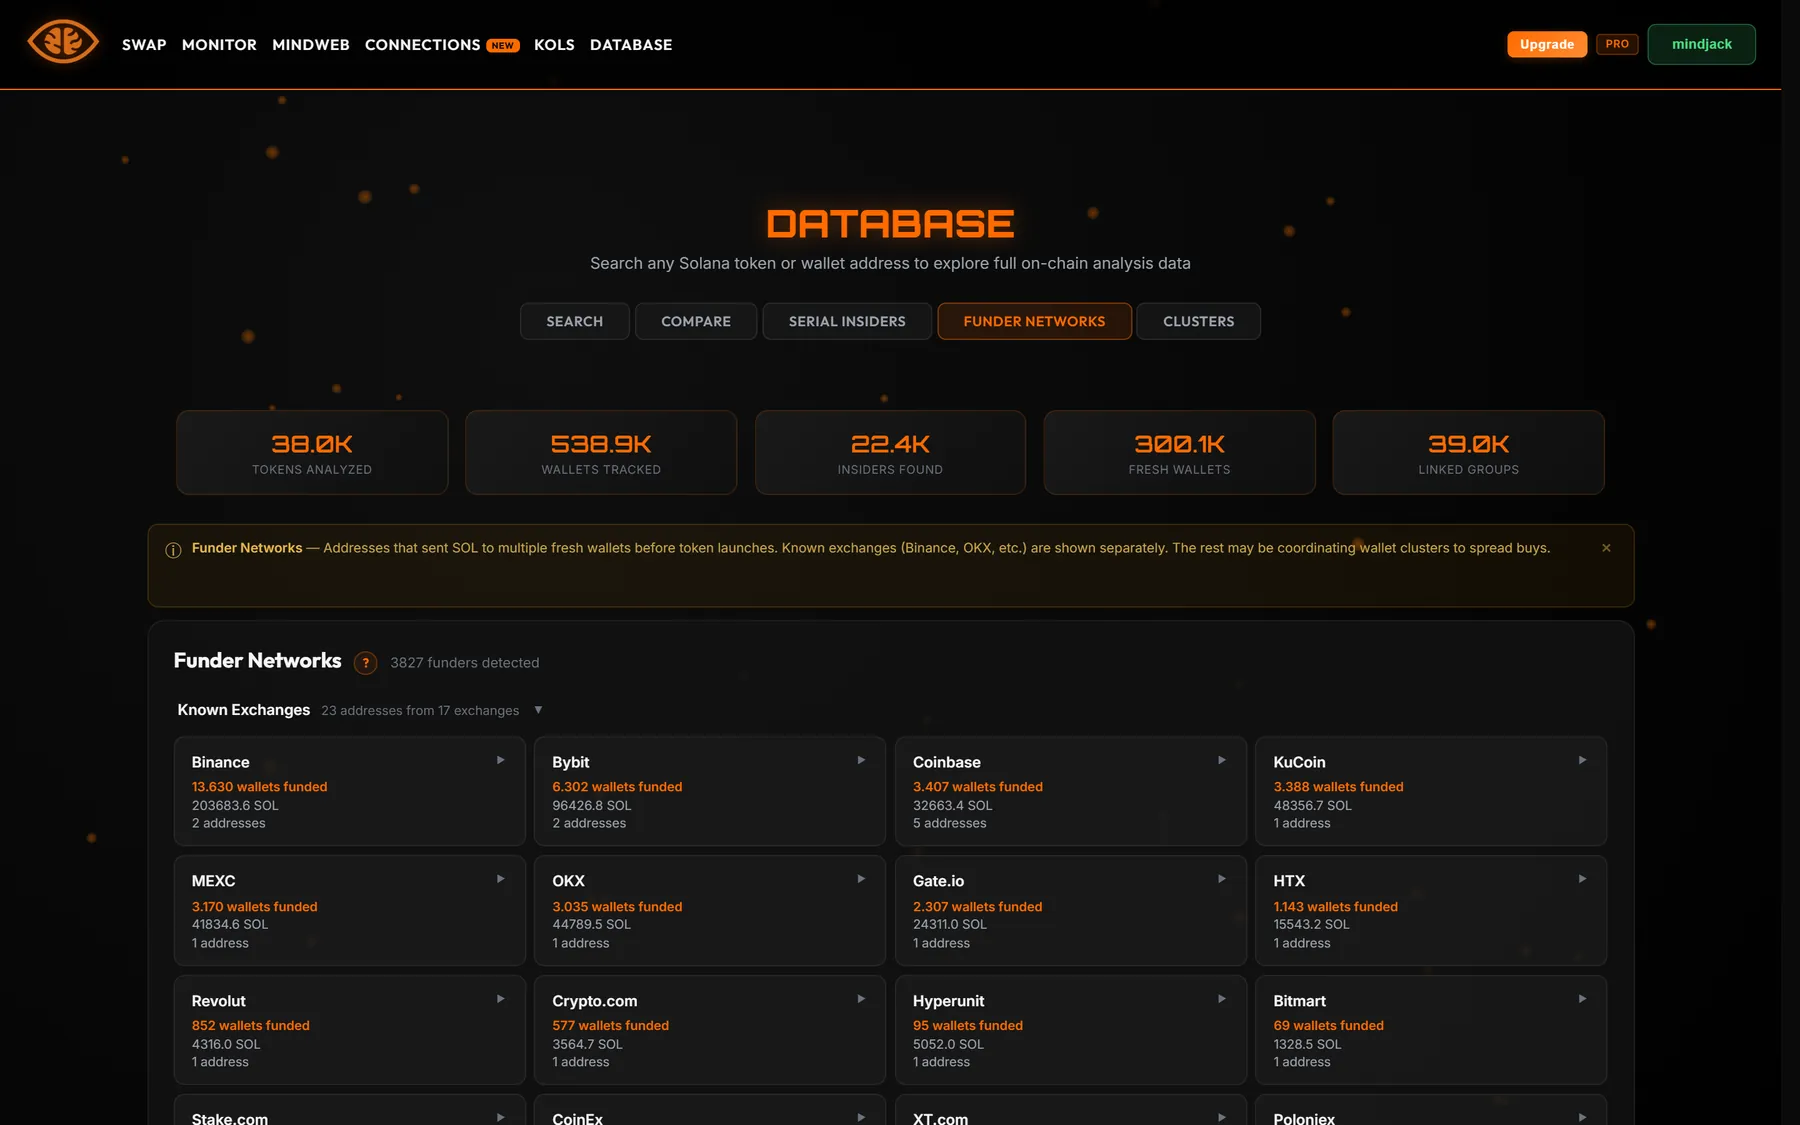
Funder Networks
"Addresses that sent SOL to multiple fresh wallets before token launches. Known
exchanges (Binance, OKX, etc.) are shown separately. The rest may be coordinating wallet
clusters to spread buys." Exchange hot wallets are grouped by venue with the number
of wallets funded and total SOL sent, so you can set them aside and focus on the funders
that aren't exchanges.
Known exchange funders are separated out so the interesting ones stand out.
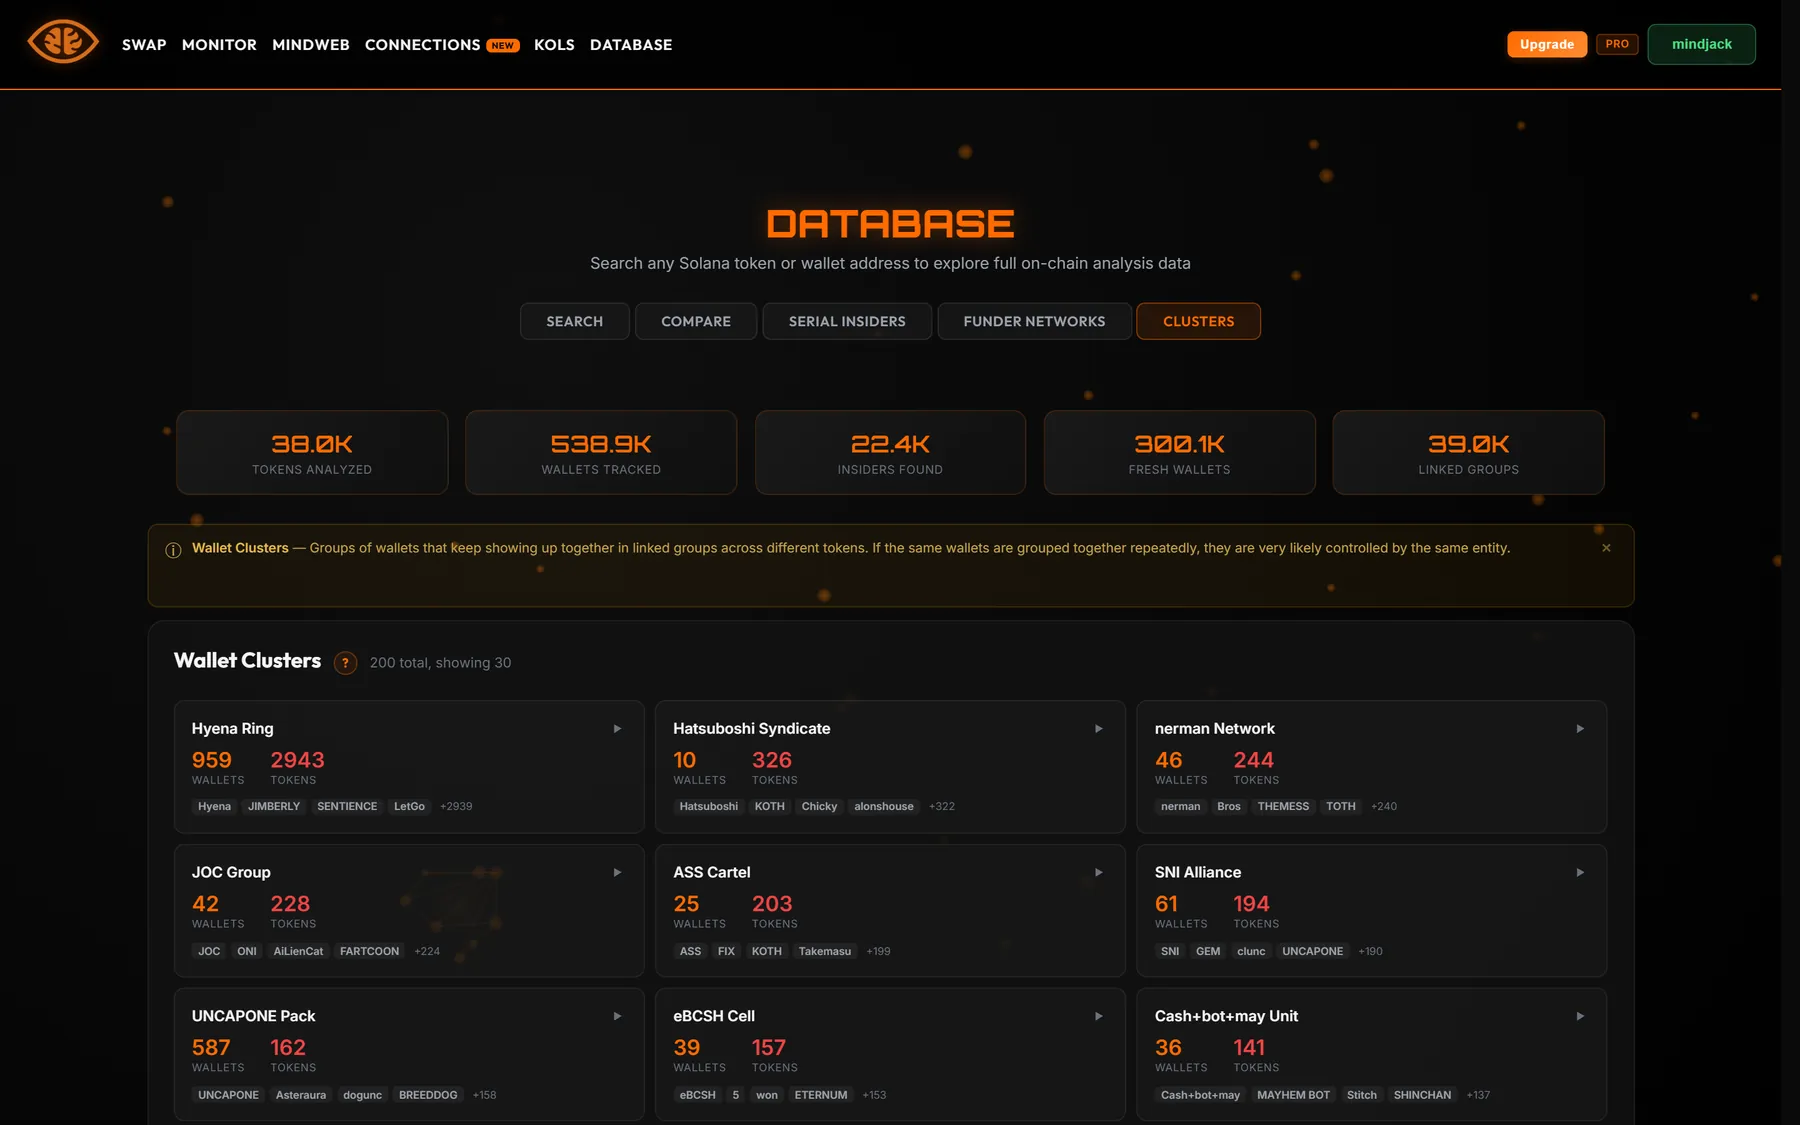
Clusters
"Groups of wallets that keep showing up together in linked groups across different
tokens. If the same wallets are grouped together repeatedly, they are very likely
controlled by the same entity." Each cluster gets a name, a wallet count, a token
count, and a preview of the tokens it has touched. Expand one for the full list.
Recurring wallet groups, named so you can recognise them again.
Tier gating
Search and the browsing modes are open to everyone. Full wallet profile records and
detailed comparison results require Pro or Mindjacker.
Portfolio
A multi-wallet Solana portfolio tracker. The page header shows how many wallets and
tokens you're tracking and when it last refreshed.
Login required
Portfolio data is private to your account. The signed-out state lists what you get:
Multi-wallet tracking · Live price updates · P&L history & charts.
Tier limits
Limit
Free
Pro
Mindjacker
Tracked wallets
1
20
100
Tokens per wallet
100
200
500
Manual refreshes / day
3
unlimited
unlimited
Auto refresh
—
hourly
hourly (fastest)
Manual asset entries
10
30
50
History window
90 days
180 days
365 days
Manual asset entries are positions you add by hand — for example an off-chain holding
you want counted alongside your on-chain balances.
Swap
Aggregated Solana DEX swaps with tier-based fees. Browseable without login; executing a
swap requires a connected and linked wallet. Full walkthrough in
Swapping tokens.
Fees
Free: 1% per swap
Pro: 0.75% per swap
Mindjacker: 0.5% per swap
On the page
Watchlist ticker bar — tokens you starred, with live price and 24h change.
Top Gainers / Top Losers / Today's Runners — 24h movers, each row starrable.
Swap Tokens — the sell/buy panel with HALF and MAX shortcuts, a refresh button, and settings.
Recent Activity — your swap history through Mindjack.
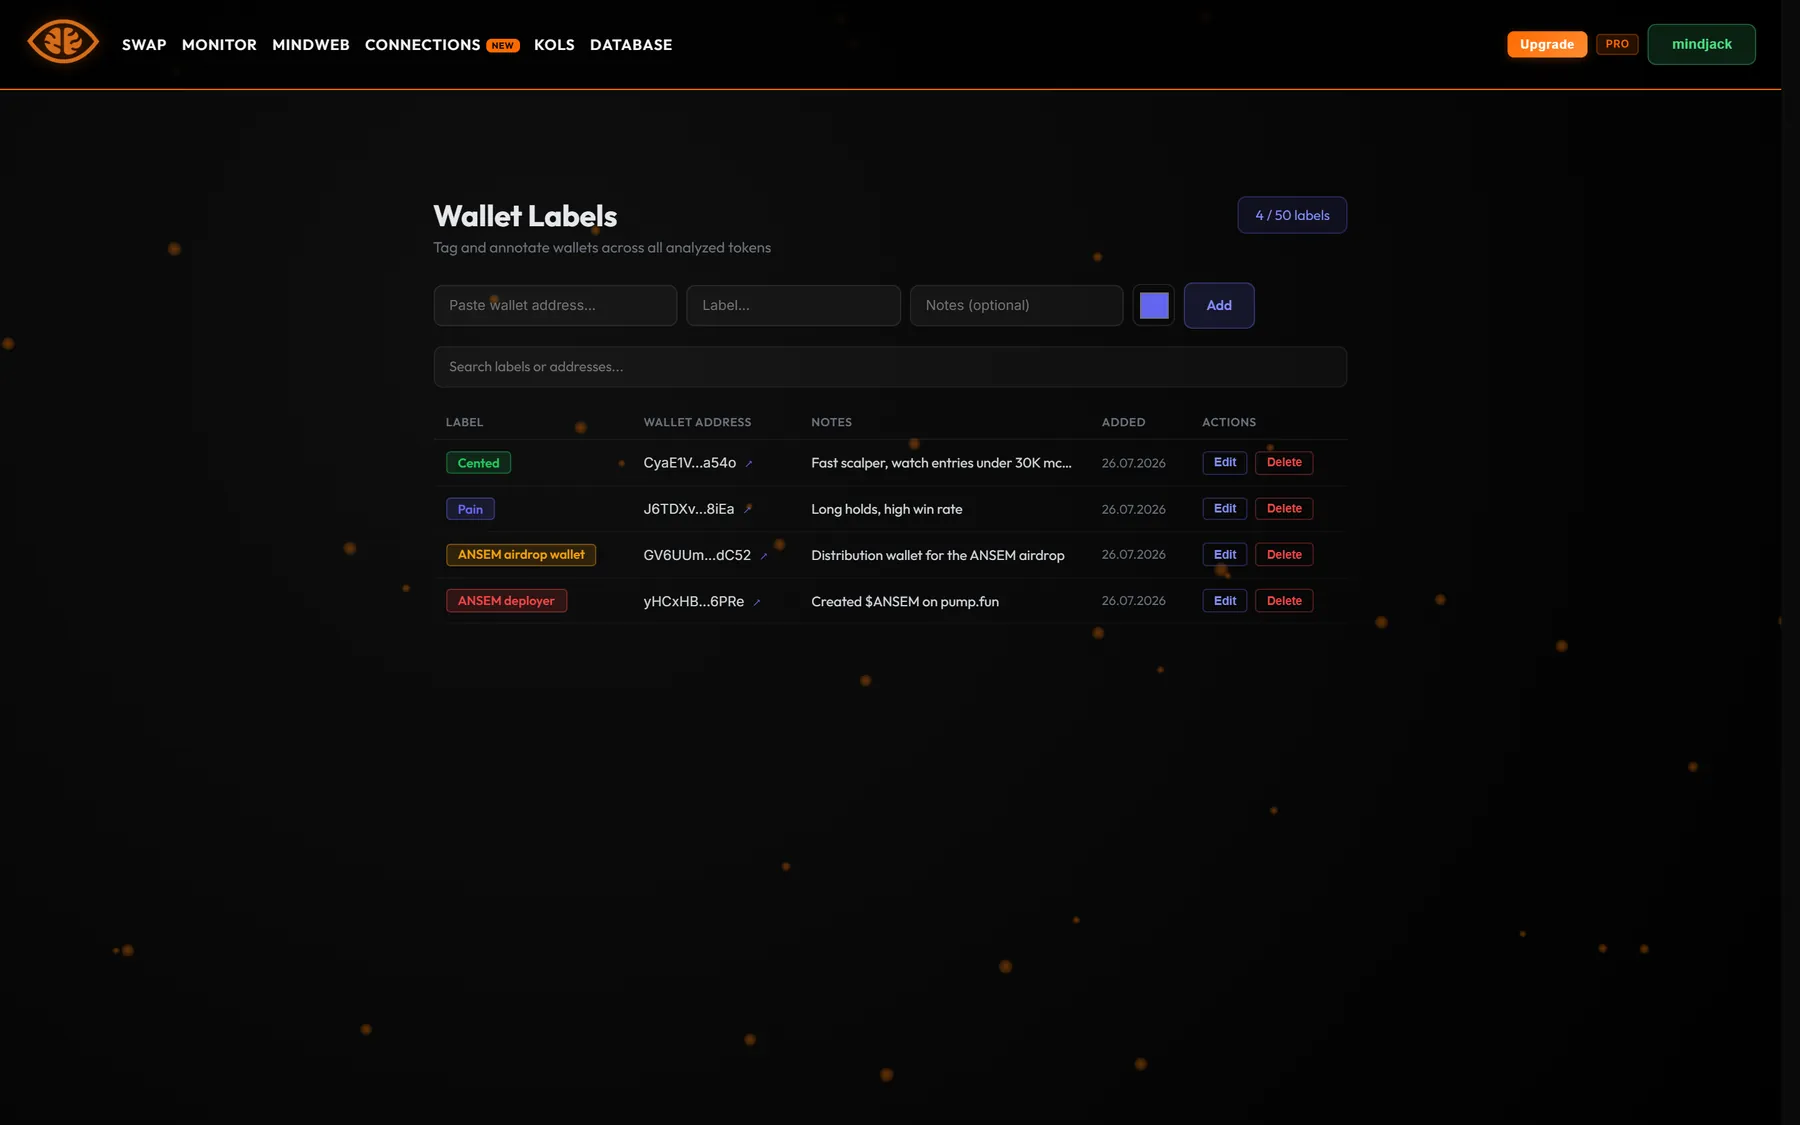
Wallet Labels
"Tag and annotate wallets across all analyzed tokens." Once you label a wallet, your
label follows it everywhere on the site — monitor graphs, KOL profiles, portfolio
entries, and Connections.
Labels are private to your account and searchable by name or address.
Creating a label
From the Wallet Labels page — fill in the form: wallet address, label (max 50 characters), notes (optional, max 200 characters), and a colour.
From the Monitor — click any wallet on the graph to open its inline label form. This is the fastest way, and the empty state on the labels page says so: "Click a wallet in Monitor to add your first label."
Managing labels
The page has a search bar ("Search labels or addresses…") and a table of every label you
have created, with columns Label, Wallet Address,
Notes, Added, Actions.
Pro and above
Wallet labels are not available on Free. Pro gets up to 50 labels,
Mindjacker up to 250.
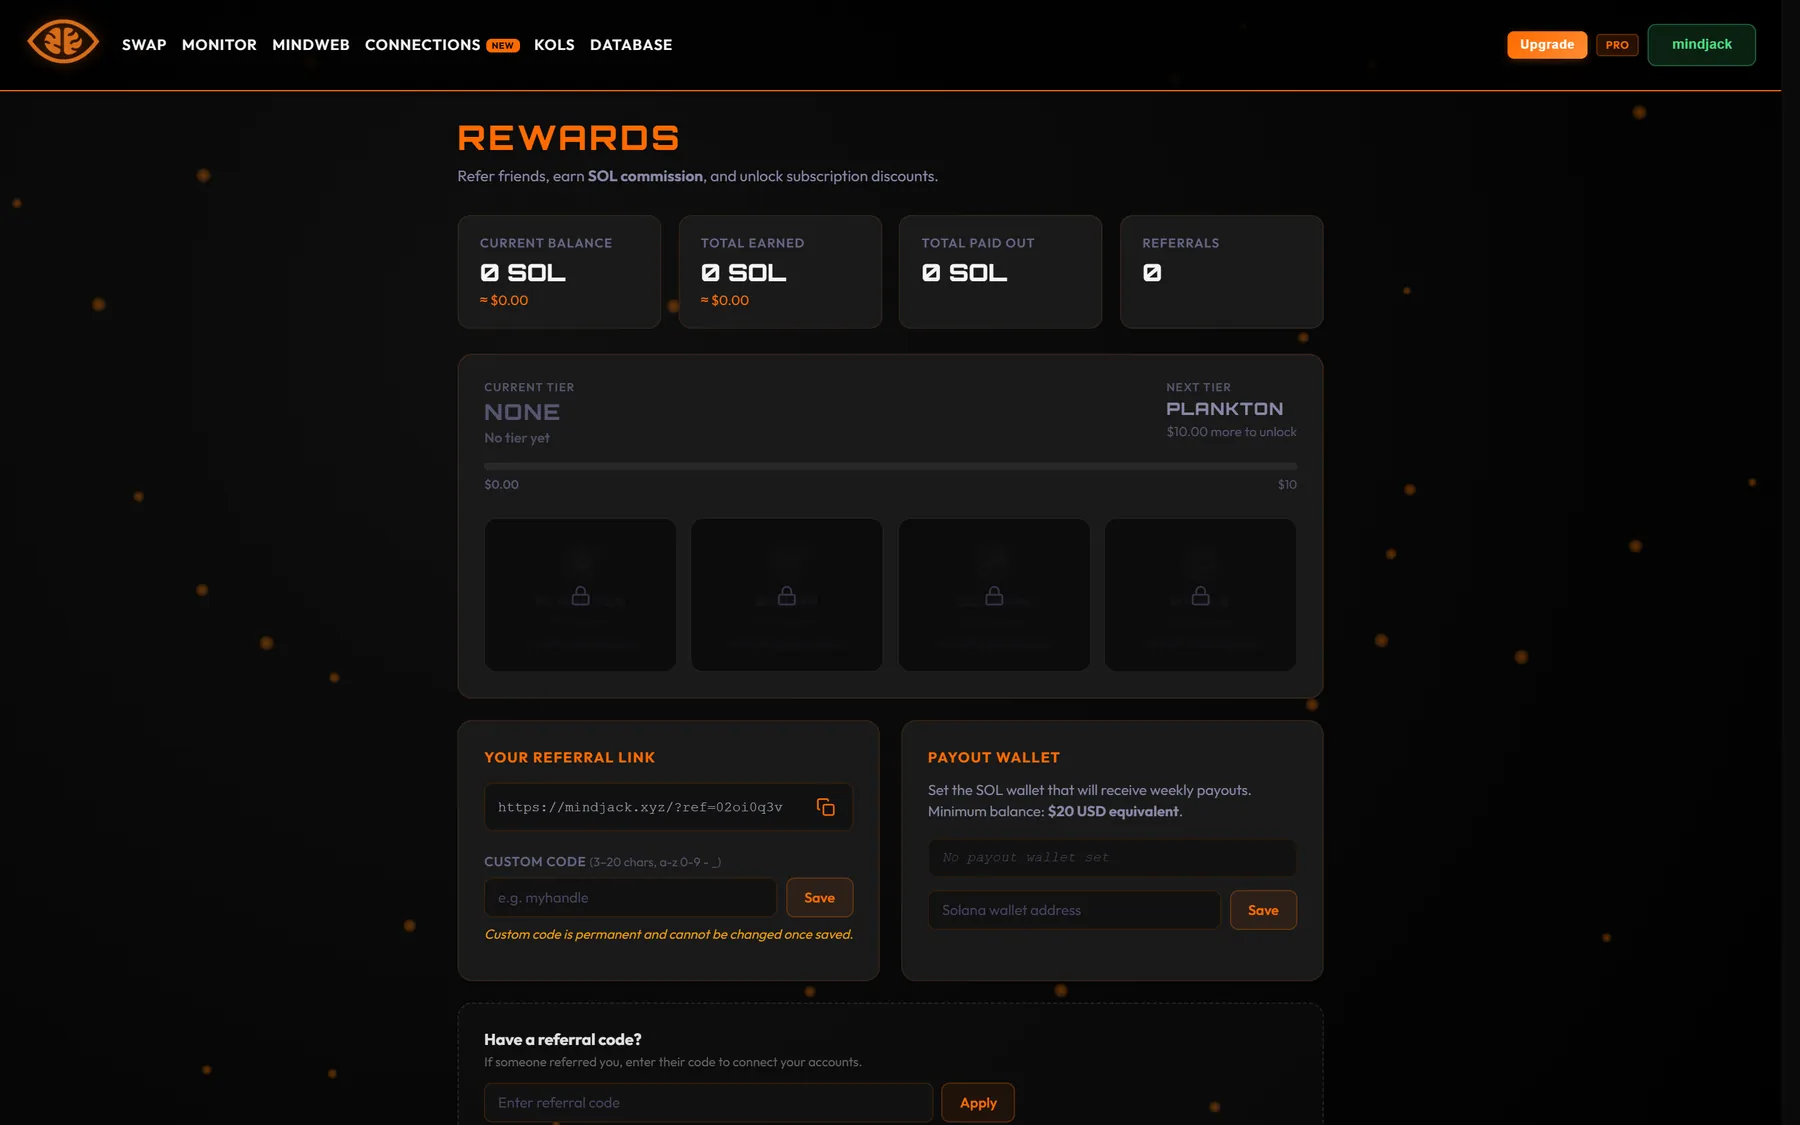
Rewards & referrals
"Refer friends, earn SOL commission, and unlock subscription discounts." Every signed-in
user gets a referral code. When someone joins through your code, you earn a
10% SOL commission — on the platform fee from their swaps, and on their
subscription payments. Earnings accumulate as SOL and pay out weekly.
The Rewards dashboard: balances, tier progress, your link, and payout settings.
Stats overview
Current Balance — unpaid SOL waiting for the next payout
Total Earned — lifetime earnings
Total Paid Out — sum of completed payouts
Referrals — number of users who joined via your code
Tier ladder
The more you earn from referrals, the bigger the discount on your own subscription. Your
tier is set by your lifetime earnings, measured in USD, and it applies
automatically at checkout — there is nothing to redeem. The page shows your current tier,
the next one, and a progress bar to it.
Tier
Earned threshold
Subscription discount
Plankton
$10
5% off
Shrimp
$25
10% off
Dolphin
$50
15% off
Whale
$100
20% off
Your referral link
You get an auto-generated code, or you can set a custom code (3–20
characters, lowercase letters, digits, hyphen or underscore). A custom code is permanent
once saved, so pick carefully. The share card in the Monitor
uses your code automatically.
Payout wallet and rules
Set the SOL wallet that receives your payouts. Payouts run automatically on a weekly
schedule. Minimum balance for a payout: $20 USD equivalent. Below that,
the balance carries over to the next week.
Using someone else's code
The "Have a referral code?" panel links your account to whoever referred you. From then
on they earn commission on your swap fees and subscription payments. It doesn't change
what you pay — your own discount comes from
your own referral earnings, not from whose code you used.
History tables
Referrals — User · Date Joined · SOL Earned
Earnings History — Date · Source · Amount (SOL)
Concepts
What the words mean
Short definitions of the terms you'll see across Mindjack and Solana.
Solana basics
Token
A digital asset on the Solana blockchain, identified by a unique mint address. Every memecoin, utility token, and wrapped asset on Solana has its own mint.
Holder
A wallet that owns a non-zero balance of a specific token. Holder counts are a common health signal — more holders usually means wider distribution.
ATA (Associated Token Account)
A per-token sub-account that a wallet uses to hold a specific SPL token. When you buy a token you haven't held before, a small amount of SOL (~0.002) is consumed to create its ATA.
Bonding curve
A pricing formula used by launchpads like pump.fun during a token's early life. Buys and sells happen against the curve instead of a traditional liquidity pool, and the price follows a fixed mathematical rule based on the remaining supply.
Migration
The moment a launchpad token graduates from its bonding curve to a full DEX market. After migration, normal DEX mechanics take over, and the token becomes part of Mindjack's public database.
Liquidity pool (LP)
A pair of token reserves that a DEX uses to quote and execute trades. Most Solana tokens trade against a SOL or USDC pool. Pool size determines how much price impact (slippage) a given trade will cause.
Market cap vs FDV
Market cap values a token using only its circulating supply. FDV (fully diluted valuation) uses the total possible supply, including tokens that haven't been issued yet. The gap matters when unissued tokens are set to unlock.
Slippage
The difference between the price you were quoted and the price you actually get. Setting a slippage tolerance tells the DEX how much of that difference you'll accept before the trade reverts.
Mindjack terms
The vocabulary you'll see across the site. The colours below match the overlay dots on the monitor graph.
Notable (gold)
A wallet holding a meaningful position — a token position worth $5K+, or $25K+ in SOL and stablecoins. Listed in the Notable Holders panel.
Insider (soft rose)
A wallet that bought very early with significant position size. Concentrations of insider wallets in the top holders are usually a warning.
Early investor
A wallet that bought inside the token's first trading window with a meaningful amount of SOL. Broader than insider — every insider is early, not every early buyer is an insider.
Fresh wallet (white)
A recently created wallet with little prior activity. Fresh wallets in the top holders of a new token are unusual and worth a closer look.
KOL (lime green)
Key Opinion Leader — a tracked smart-money wallet from the KOL Tracker. When a KOL holds a token, it shows up with this overlay.
Sniper (cyan)
A wallet that bought in the very first moments of trading. Counted in the dedicated Snipers warning category.
Ghost node
A wallet drawn on the monitor that isn't a current top holder but is relevant to a group — for example a funder that bankrolled several holders.
Linked wallets
Wallets Mindjack has determined to be related to one another. They share a group on the monitor and contribute to Controlled %.
Controlled % / Possible Supply Control
The percentage of total supply held by wallets in coordinated groups. Higher numbers mean more concentration in related hands.
Bundle
Multiple wallets buying in the same transaction at launch. Bundled wallets are almost always operated by one person.
Top 10 %
Share of supply held by the top 10 holders combined.
Top 50 SOL
Total SOL balance held collectively by the top 50 wallets of this token. A proxy for how well-capitalised the holder base is.
Median SOL
The median SOL balance across the top wallets of a token. Anomalous values trigger the Median SOL warning.
Scalp score
A 0–100 indicator of serial profit-extraction behaviour across a token's wallets. Higher means more scalping.
Fake Vol %
Estimated share of a token's trading volume that appears artificial — wash trading, self-trades, and similar patterns.
Warning
A yellow chip: one of the six monitored signals tripped at the lower threshold. Worth a second look.
Critical
A red chip: one of the six signals tripped at a higher threshold. Treat with serious caution.
Migration Snapshot
The state of a token at the moment it migrated, captured by the automatic analysis. Refreshing a token replaces the displayed numbers with a newer snapshot.
Account
Account, plans, billing
How sign-in works, what each plan costs, and the most common questions.
Account & login
Signing in
Mindjack accepts email (one-time code), Google, X, and four Solana wallets — Phantom,
Solflare, Backpack, and Jupiter. Wallet options only show up if the extension is
installed. Whichever method you pick, the account it creates is the same; the only
difference is how you prove you own it.
Username
After your first sign-in you're offered a username (3–20 characters). It's optional and
you can set or change it later from your profile.
Wallets vs login
Signing in and connecting a trading wallet are two different things. You can sign in with
email and still connect a wallet for swaps; the site walks you through a one-time
signature to link it. Mindjack never takes custody of funds and never asks for private
keys — every signature request is tied to an action you started.
Where your limits live
Your current plan, quota counters, and remaining daily viewing time are visible in the
interface itself: the timer pill on the Monitor and KOL Tracker, the badge on the Refresh
button, and the tier chip in the navbar.
Feedback & support
The Feedback button floats in the bottom-right corner of every page.
Pick a category — Idea, Bug, or Other —
write up to 1,200 characters, and send. It goes straight to us and we read all of it.
For anything that needs a conversation, message
@freyotri on Telegram
directly. Product updates go out on the
announcements
channel and on X;
new features also announce themselves in-app the first time you open an affected page.
Legal
The Terms of Service and Privacy Policy are
linked from the footer of every page. Mindjack is an analytics tool: nothing on the site
is financial advice, and no signal it produces is a recommendation to buy or sell.
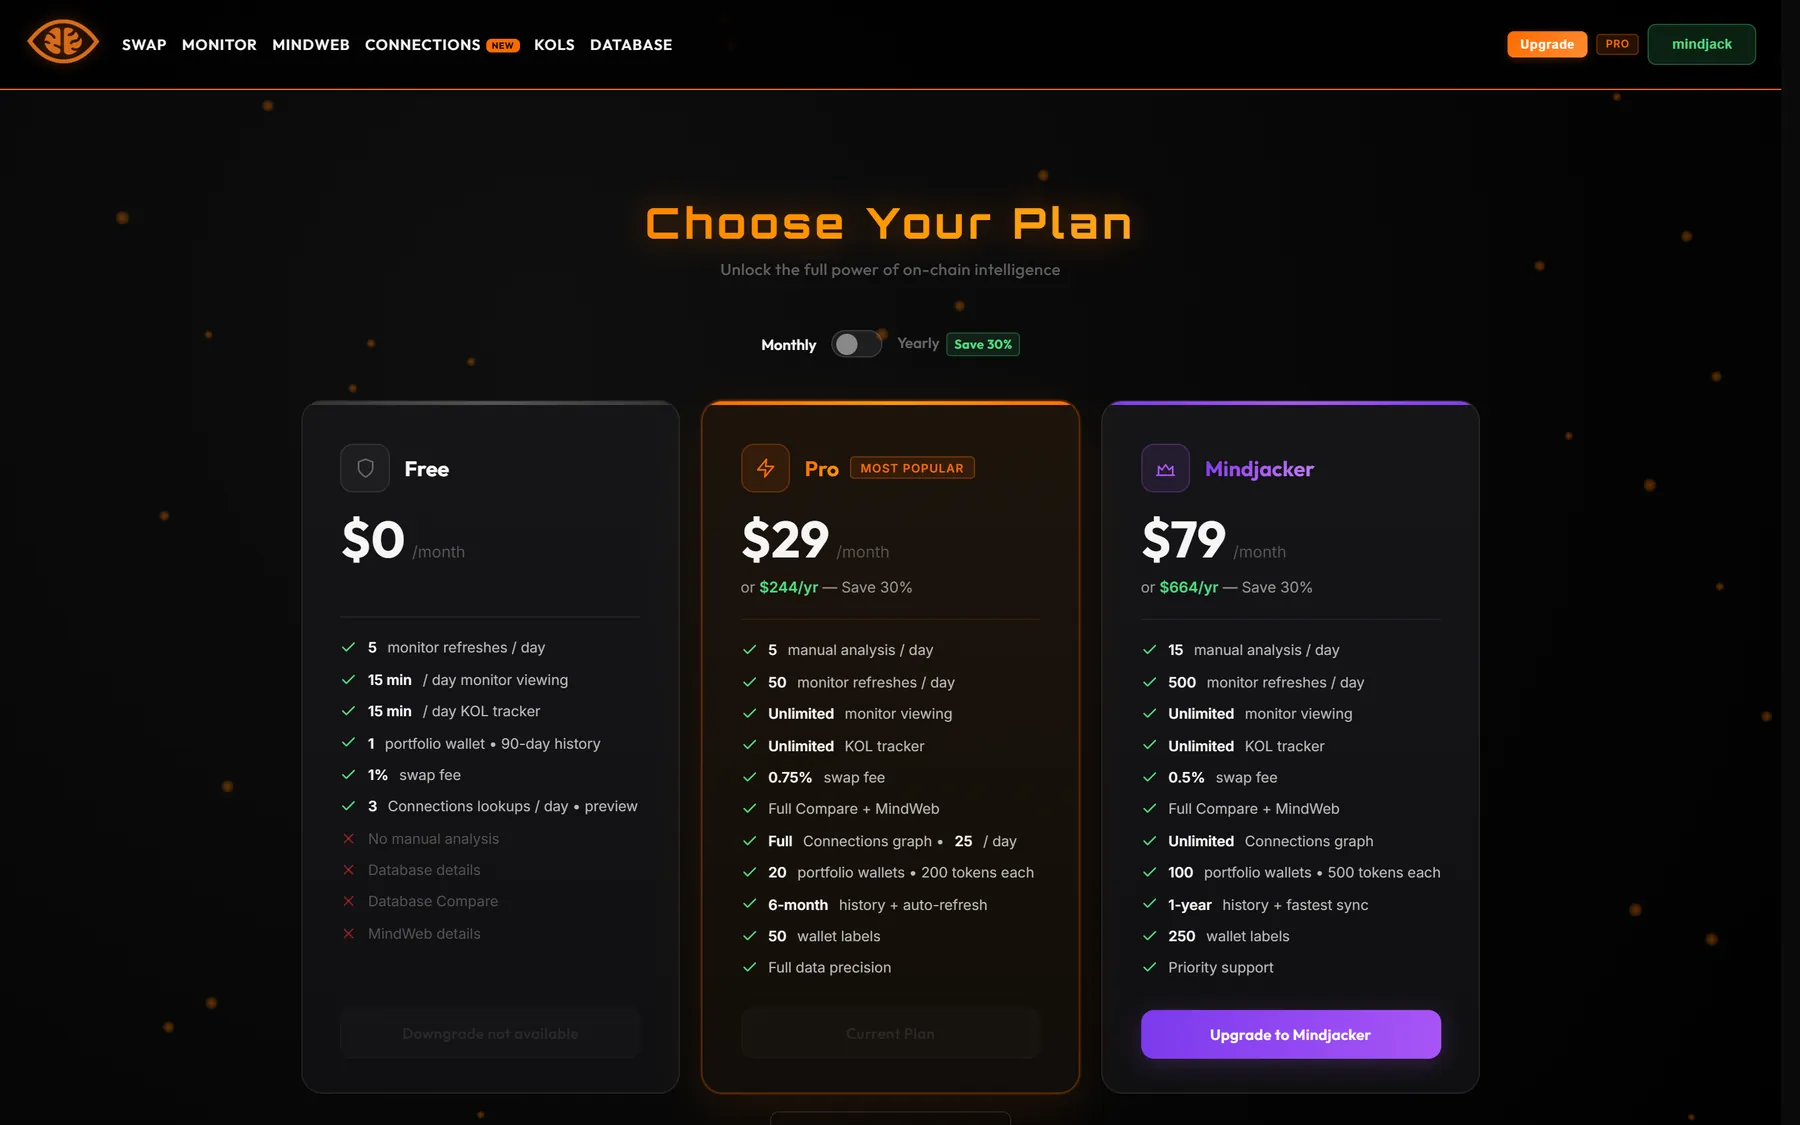
Plans & limits
Three tiers — Free, Pro, and Mindjacker — plus a one-time payment option for
pre-migration analysis. Subscriptions are paid in SOL or USDC on Solana mainnet.
Free
$0/mo
5 monitor refreshes / day
15 min/day Monitor viewing
15 min/day KOL Tracker viewing
3 Connections lookups / day (preview)
1 portfolio wallet · 3 refreshes/day
1% swap fee
No manual analyses
No wallet labels
Pro
$29/mo
5 manual analyses / day
50 monitor refreshes / day
Unlimited Monitor & KOL viewing
25 Connections lookups / day (full graph)
20 portfolio wallets · auto refresh
50 wallet labels
0.75% swap fee
Mindweb & compare details
Mindjacker
$79/mo
15 manual analyses / day
500 monitor refreshes / day
Unlimited Monitor & KOL viewing
Unlimited Connections lookups
100 portfolio wallets · auto refresh
250 wallet labels
0.5% swap fee
Priority support
The pricing page has the full side-by-side comparison and the billing toggle.
Full comparison
Feature
Free
Pro
Mindjacker
Manual analysis / day
—
5
15
Monitor refreshes / day
5
50
500
Monitor viewing time
15 min / day
Unlimited
Unlimited
KOL tracker viewing
15 min / day
Unlimited
Unlimited
Token & wallet search
Yes
Yes
Yes
Wallet profile records
—
Yes
Yes
Comparison details
—
Yes
Yes
Mindweb connection details
—
Yes
Yes
Data precision
Limited
Full
Full
Connections lookups / day
3
25
Unlimited
Wallet network graph
Preview
Full
Full
Multi-hop network & clusters
—
Yes
Yes
Funding sources & shared tokens
—
Yes
Yes
Portfolio wallets
1
20
100
Tokens per wallet
100
200
500
Portfolio history
90 days
6 months
1 year
Portfolio refresh
Manual (3/day)
Auto (1h)
Auto (1h, fastest)
Wallet labels
—
50
250
Swap fee
1%
0.75%
0.5%
Priority support
—
—
Yes
Pay-as-you-go: $5 per analysis
Don't want a subscription but need a specific pre-migration token analyzed? Pay
$5 in SOL or USDC per manual analysis, straight from the manual analysis
modal. One analysis, no plan commitment.
Yearly billing
Pro and Mindjacker are 30% cheaper billed yearly: Pro $244/year,
Mindjacker $664/year.
Billing & payments
How a payment works
Pick a plan and billing period on the pricing page.
Click Pay Now. Mindjack shows the exact amount and the target wallet before anything happens.
Approve the transaction in your wallet. Payments are in SOL or USDC on Solana mainnet — no card, no fiat rails.
The payment is verified on-chain automatically. Once it confirms, your account upgrades immediately.
Checking your subscription
The pricing page shows your current plan, status, expiry date, and days remaining once
you're subscribed. Your tier chip is also visible in the navbar on every page.
Upgrades and downgrades
Upgrades take effect immediately. Downgrades are not currently supported — your existing
plan stays active until it expires, after which you drop back to Free.
Referral discounts
If your own referral earnings have reached a tier, the
matching discount (5% to 20%) is applied to the price you see at checkout automatically.
Nothing to enter, nothing to redeem.
FAQ
Do I need an account to use Mindjack?
Mostly no. You can browse the Monitor, Database, KOL Tracker, Mindweb, and Swap quotes without signing in — subject to the daily viewing-time caps on the Monitor and KOL Tracker. An account is needed for personal features (Portfolio, Rewards, wallet labels, Connections) and for anything that executes (manual analysis, swapping, copy-trading from the KOL Tracker).
How do I analyze a token?
It depends on whether the token has migrated. If it has, Mindjack already analyzed it automatically — just look it up in the Monitor or Database. If it hasn't migrated yet, run a manual analysis: use a daily quota slot (Pro 5/day, Mindjacker 15/day), spend a credit, or pay $5.
Which launchpads are supported for pre-migration analysis?
pump.fun, Bags, Printr, and LetsBonk. The token must still be on its bonding curve and must have been created within the last 14 days.
Where do credits come from? Can I buy them?
You can't buy credits. You earn them: when a manual analysis fails or is cancelled, you get 1 credit back. Credits are capped at 10 to prevent farming, and they don't expire.
How fresh is the monitor data?
Each token's monitor shows a snapshot from the moment Mindjack analyzed it. It does not update on its own. To pull a newer snapshot, open the token and click Refresh. Refreshes count against your daily quota: 5/day on Free, 50/day on Pro, 500/day on Mindjacker. Price, liquidity, market cap, and the chart are live and independent of the snapshot.
What counts against my daily viewing time?
Only active use of the Monitor and KOL Tracker. The page sends a heartbeat every 60 seconds while you're interacting with it; a backgrounded tab or an idle window doesn't burn time. Pro and Mindjacker have no cap at all.
How does payment work?
Pay in SOL or USDC on Solana mainnet. The exact amount is shown before you approve. Your account upgrades — or your analysis is queued — the moment the payment confirms on-chain. No card, no fiat rails.
Can I upgrade or downgrade my plan?
Upgrades take effect immediately. Downgrades are not currently supported — your existing plan stays active until it expires.
Is there a free trial?
The Free tier is permanent — no trial timer, no card on file, no auto-upgrade. You can use Mindjack on Free indefinitely, within its daily limits.
Where does the data come from?
Everything is sourced from the Solana blockchain plus standard market-data providers for price and volume. We intentionally don't publish the internals of the analysis pipeline or the exact thresholds behind the warnings.
Is my wallet safe?
Mindjack only requests signatures for actions you start yourself: login, wallet linking, swaps, subscription payments, and manual analysis payments. It never custodies funds and never asks for your private keys.
A warning chip looks wrong for this token. What now?
Warnings are signals, not verdicts. A high top-10 percentage on a token with a locked treasury, for example, is expected rather than alarming. Open the token and read the underlying numbers — the graph, the groups, and the trading split — before drawing a conclusion.